South American vs Alaskan Athabascan Single Mother Poverty
COMPARE
South American
Alaskan Athabascan
Single Mother Poverty
Single Mother Poverty Comparison
South Americans
Alaskan Athabascans
28.4%
SINGLE MOTHER POVERTY
90.4/ 100
METRIC RATING
129th/ 347
METRIC RANK
30.3%
SINGLE MOTHER POVERTY
4.1/ 100
METRIC RATING
232nd/ 347
METRIC RANK
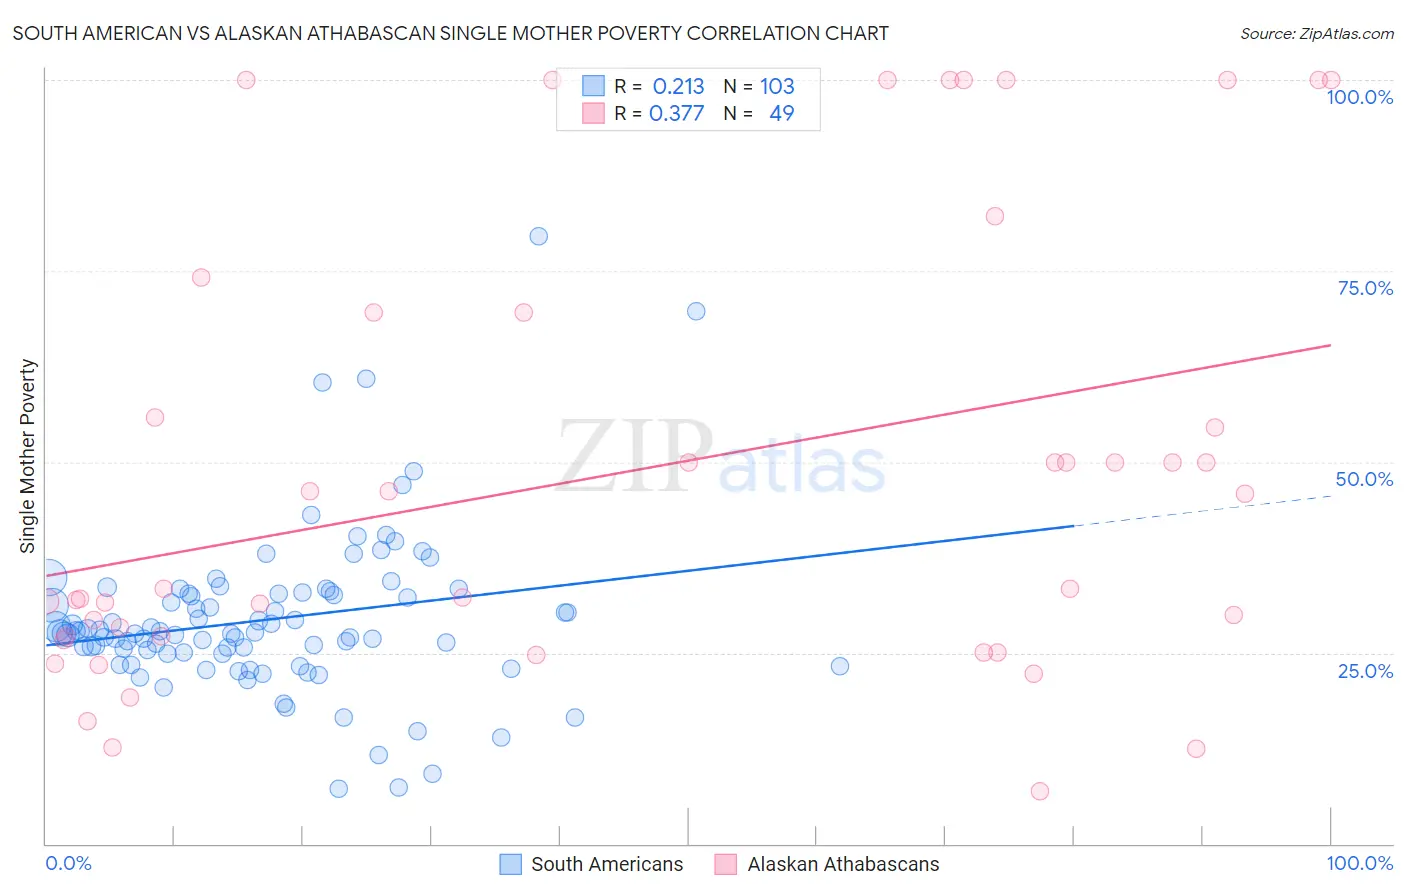
South American vs Alaskan Athabascan Single Mother Poverty Correlation Chart
The statistical analysis conducted on geographies consisting of 477,647,095 people shows a weak positive correlation between the proportion of South Americans and poverty level among single mothers in the United States with a correlation coefficient (R) of 0.213 and weighted average of 28.4%. Similarly, the statistical analysis conducted on geographies consisting of 45,529,547 people shows a mild positive correlation between the proportion of Alaskan Athabascans and poverty level among single mothers in the United States with a correlation coefficient (R) of 0.377 and weighted average of 30.3%, a difference of 6.6%.
Single Mother Poverty Correlation Summary
| Measurement | South American | Alaskan Athabascan |
| Minimum | 7.3% | 6.8% |
| Maximum | 79.6% | 100.0% |
| Range | 72.3% | 93.2% |
| Mean | 29.3% | 48.6% |
| Median | 27.6% | 33.3% |
| Interquartile 25% (IQ1) | 24.9% | 26.9% |
| Interquartile 75% (IQ3) | 32.8% | 69.6% |
| Interquartile Range (IQR) | 7.9% | 42.6% |
| Standard Deviation (Sample) | 10.7% | 29.3% |
| Standard Deviation (Population) | 10.6% | 29.0% |
Similar Demographics by Single Mother Poverty
Demographics Similar to South Americans by Single Mother Poverty
In terms of single mother poverty, the demographic groups most similar to South Americans are Norwegian (28.4%, a difference of 0.0%), Immigrants from England (28.4%, a difference of 0.020%), Immigrants from Austria (28.4%, a difference of 0.020%), Polish (28.4%, a difference of 0.060%), and Kenyan (28.4%, a difference of 0.070%).
| Demographics | Rating | Rank | Single Mother Poverty |
| Colombians | 91.8 /100 | #122 | Exceptional 28.3% |
| Uruguayans | 91.7 /100 | #123 | Exceptional 28.3% |
| Immigrants | Switzerland | 91.7 /100 | #124 | Exceptional 28.3% |
| Kenyans | 90.9 /100 | #125 | Exceptional 28.4% |
| Immigrants | Chile | 90.8 /100 | #126 | Exceptional 28.4% |
| Poles | 90.8 /100 | #127 | Exceptional 28.4% |
| Immigrants | England | 90.5 /100 | #128 | Exceptional 28.4% |
| South Americans | 90.4 /100 | #129 | Exceptional 28.4% |
| Norwegians | 90.4 /100 | #130 | Exceptional 28.4% |
| Immigrants | Austria | 90.3 /100 | #131 | Exceptional 28.4% |
| Immigrants | Morocco | 89.5 /100 | #132 | Excellent 28.4% |
| Swedes | 89.4 /100 | #133 | Excellent 28.4% |
| Immigrants | Southern Europe | 89.2 /100 | #134 | Excellent 28.4% |
| Immigrants | Spain | 89.2 /100 | #135 | Excellent 28.4% |
| Native Hawaiians | 88.9 /100 | #136 | Excellent 28.4% |
Demographics Similar to Alaskan Athabascans by Single Mother Poverty
In terms of single mother poverty, the demographic groups most similar to Alaskan Athabascans are Dutch (30.2%, a difference of 0.040%), English (30.2%, a difference of 0.19%), Immigrants from Middle Africa (30.3%, a difference of 0.21%), Immigrants from Nicaragua (30.3%, a difference of 0.22%), and Immigrants from Barbados (30.2%, a difference of 0.23%).
| Demographics | Rating | Rank | Single Mother Poverty |
| Spanish | 6.3 /100 | #225 | Tragic 30.1% |
| Scottish | 6.0 /100 | #226 | Tragic 30.1% |
| Immigrants | Liberia | 5.9 /100 | #227 | Tragic 30.1% |
| Spaniards | 5.4 /100 | #228 | Tragic 30.2% |
| Immigrants | Barbados | 5.0 /100 | #229 | Tragic 30.2% |
| English | 4.8 /100 | #230 | Tragic 30.2% |
| Dutch | 4.3 /100 | #231 | Tragic 30.2% |
| Alaskan Athabascans | 4.1 /100 | #232 | Tragic 30.3% |
| Immigrants | Middle Africa | 3.5 /100 | #233 | Tragic 30.3% |
| Immigrants | Nicaragua | 3.5 /100 | #234 | Tragic 30.3% |
| Immigrants | Grenada | 3.4 /100 | #235 | Tragic 30.3% |
| Welsh | 3.2 /100 | #236 | Tragic 30.4% |
| Immigrants | St. Vincent and the Grenadines | 3.1 /100 | #237 | Tragic 30.4% |
| Slovaks | 2.8 /100 | #238 | Tragic 30.4% |
| Immigrants | Portugal | 2.1 /100 | #239 | Tragic 30.5% |