Hmong vs Crow Single Male Poverty
COMPARE
Hmong
Crow
Single Male Poverty
Single Male Poverty Comparison
Hmong
Crow
14.2%
SINGLE MALE POVERTY
0.0/ 100
METRIC RATING
280th/ 347
METRIC RANK
23.3%
SINGLE MALE POVERTY
0.0/ 100
METRIC RATING
341st/ 347
METRIC RANK
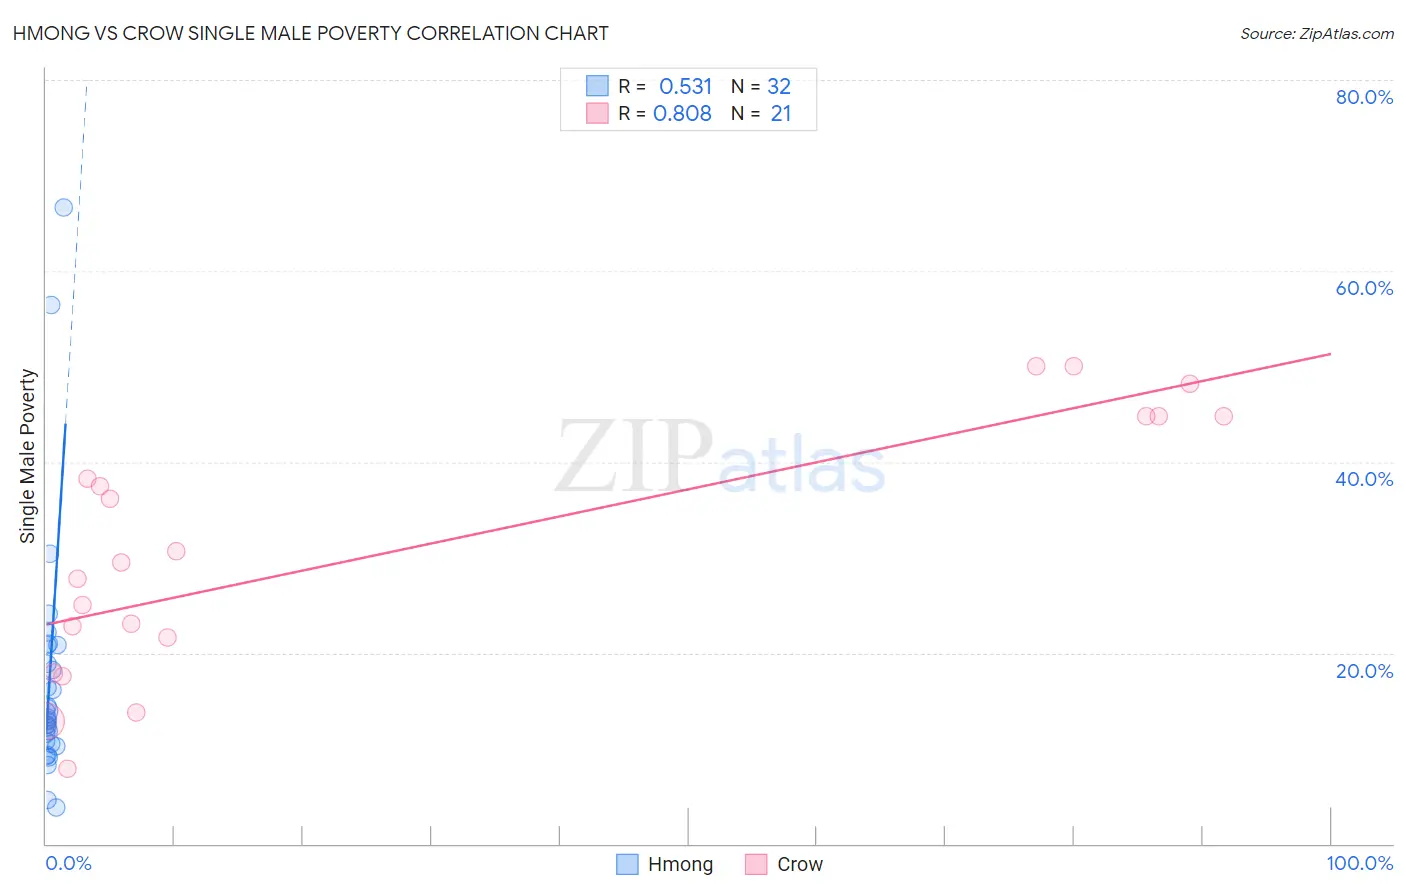
Hmong vs Crow Single Male Poverty Correlation Chart
The statistical analysis conducted on geographies consisting of 24,410,058 people shows a substantial positive correlation between the proportion of Hmong and poverty level among single males in the United States with a correlation coefficient (R) of 0.531 and weighted average of 14.2%. Similarly, the statistical analysis conducted on geographies consisting of 57,394,194 people shows a very strong positive correlation between the proportion of Crow and poverty level among single males in the United States with a correlation coefficient (R) of 0.808 and weighted average of 23.3%, a difference of 63.9%.
Single Male Poverty Correlation Summary
| Measurement | Hmong | Crow |
| Minimum | 3.8% | 7.9% |
| Maximum | 66.7% | 50.0% |
| Range | 62.9% | 42.1% |
| Mean | 17.1% | 30.7% |
| Median | 13.0% | 29.4% |
| Interquartile 25% (IQ1) | 10.6% | 19.7% |
| Interquartile 75% (IQ3) | 19.8% | 44.8% |
| Interquartile Range (IQR) | 9.2% | 25.0% |
| Standard Deviation (Sample) | 13.0% | 13.2% |
| Standard Deviation (Population) | 12.8% | 12.9% |
Similar Demographics by Single Male Poverty
Demographics Similar to Hmong by Single Male Poverty
In terms of single male poverty, the demographic groups most similar to Hmong are Hispanic or Latino (14.2%, a difference of 0.030%), Spanish American (14.2%, a difference of 0.18%), Yaqui (14.2%, a difference of 0.34%), Indonesian (14.1%, a difference of 0.70%), and Slovak (14.1%, a difference of 0.74%).
| Demographics | Rating | Rank | Single Male Poverty |
| Welsh | 0.1 /100 | #273 | Tragic 14.0% |
| Hondurans | 0.1 /100 | #274 | Tragic 14.0% |
| English | 0.1 /100 | #275 | Tragic 14.1% |
| Dutch | 0.1 /100 | #276 | Tragic 14.1% |
| Immigrants | Honduras | 0.0 /100 | #277 | Tragic 14.1% |
| Slovaks | 0.0 /100 | #278 | Tragic 14.1% |
| Indonesians | 0.0 /100 | #279 | Tragic 14.1% |
| Hmong | 0.0 /100 | #280 | Tragic 14.2% |
| Hispanics or Latinos | 0.0 /100 | #281 | Tragic 14.2% |
| Spanish Americans | 0.0 /100 | #282 | Tragic 14.2% |
| Yaqui | 0.0 /100 | #283 | Tragic 14.2% |
| Immigrants | Bahamas | 0.0 /100 | #284 | Tragic 14.4% |
| French | 0.0 /100 | #285 | Tragic 14.4% |
| Celtics | 0.0 /100 | #286 | Tragic 14.5% |
| Iroquois | 0.0 /100 | #287 | Tragic 14.5% |
Demographics Similar to Crow by Single Male Poverty
In terms of single male poverty, the demographic groups most similar to Crow are Houma (23.5%, a difference of 0.82%), Sioux (22.2%, a difference of 4.7%), Arapaho (21.9%, a difference of 6.0%), Pueblo (21.6%, a difference of 7.6%), and Puerto Rican (25.1%, a difference of 7.8%).
| Demographics | Rating | Rank | Single Male Poverty |
| Inupiat | 0.0 /100 | #333 | Tragic 20.0% |
| Pima | 0.0 /100 | #334 | Tragic 20.2% |
| Yuman | 0.0 /100 | #335 | Tragic 21.3% |
| Tohono O'odham | 0.0 /100 | #336 | Tragic 21.6% |
| Apache | 0.0 /100 | #337 | Tragic 21.6% |
| Pueblo | 0.0 /100 | #338 | Tragic 21.6% |
| Arapaho | 0.0 /100 | #339 | Tragic 21.9% |
| Sioux | 0.0 /100 | #340 | Tragic 22.2% |
| Crow | 0.0 /100 | #341 | Tragic 23.3% |
| Houma | 0.0 /100 | #342 | Tragic 23.5% |
| Puerto Ricans | 0.0 /100 | #343 | Tragic 25.1% |
| Lumbee | 0.0 /100 | #344 | Tragic 25.2% |
| Navajo | 0.0 /100 | #345 | Tragic 25.3% |
| Hopi | 0.0 /100 | #346 | Tragic 27.5% |
| Yup'ik | 0.0 /100 | #347 | Tragic 31.6% |