Hispanic or Latino vs Nigerian Family Poverty
COMPARE
Hispanic or Latino
Nigerian
Family Poverty
Family Poverty Comparison
Hispanics or Latinos
Nigerians
12.0%
FAMILY POVERTY
0.0/ 100
METRIC RATING
309th/ 347
METRIC RANK
10.1%
FAMILY POVERTY
2.0/ 100
METRIC RATING
235th/ 347
METRIC RANK
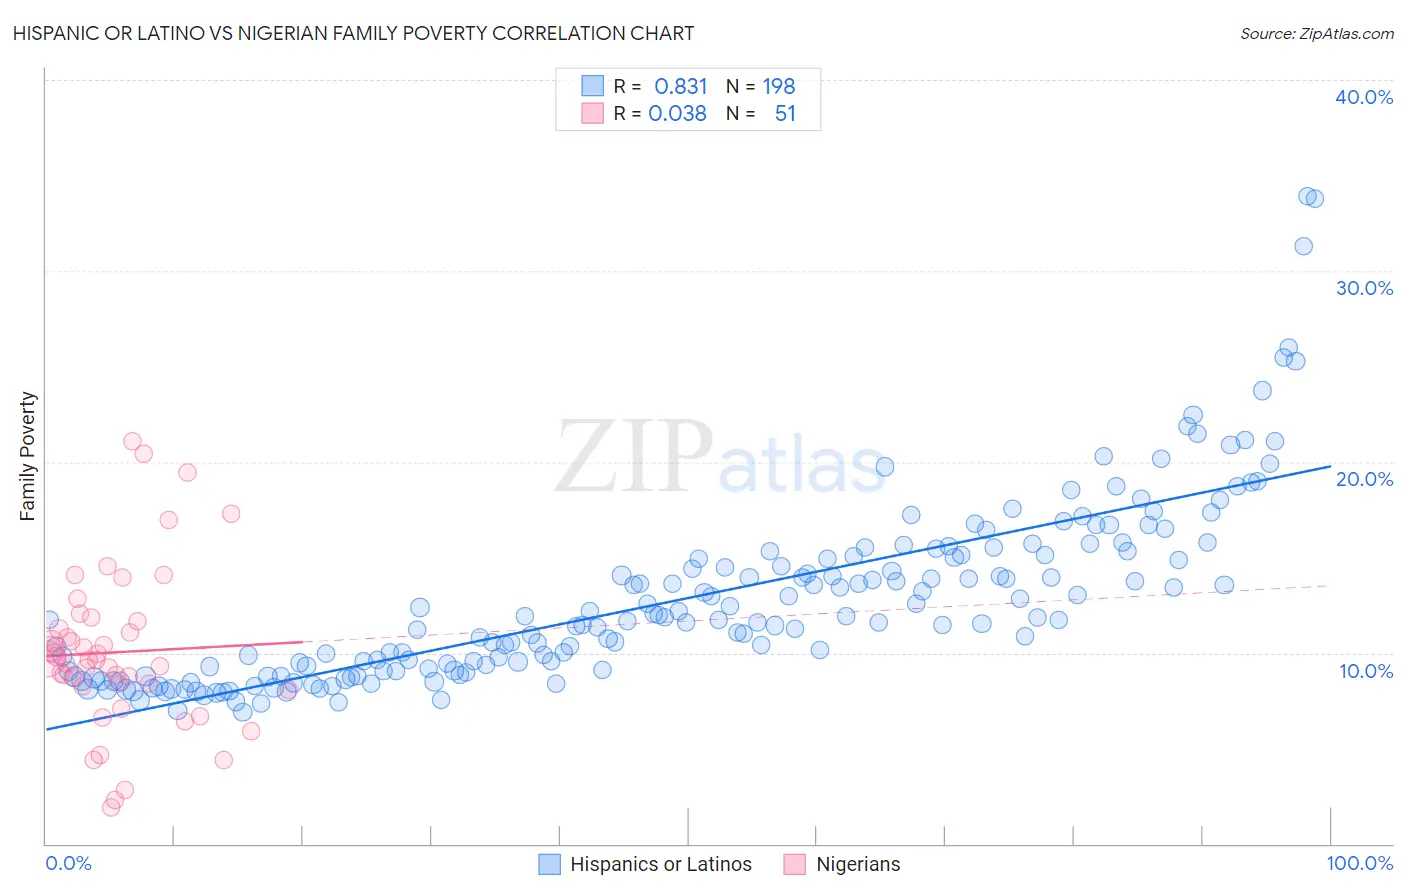
Hispanic or Latino vs Nigerian Family Poverty Correlation Chart
The statistical analysis conducted on geographies consisting of 570,393,322 people shows a very strong positive correlation between the proportion of Hispanics or Latinos and poverty level among families in the United States with a correlation coefficient (R) of 0.831 and weighted average of 12.0%. Similarly, the statistical analysis conducted on geographies consisting of 332,122,343 people shows no correlation between the proportion of Nigerians and poverty level among families in the United States with a correlation coefficient (R) of 0.038 and weighted average of 10.1%, a difference of 17.8%.
Family Poverty Correlation Summary
| Measurement | Hispanic or Latino | Nigerian |
| Minimum | 6.9% | 1.9% |
| Maximum | 33.9% | 21.1% |
| Range | 27.0% | 19.2% |
| Mean | 12.8% | 10.0% |
| Median | 11.7% | 9.6% |
| Interquartile 25% (IQ1) | 9.1% | 8.3% |
| Interquartile 75% (IQ3) | 15.0% | 11.6% |
| Interquartile Range (IQR) | 6.0% | 3.4% |
| Standard Deviation (Sample) | 4.8% | 4.2% |
| Standard Deviation (Population) | 4.7% | 4.1% |
Similar Demographics by Family Poverty
Demographics Similar to Hispanics or Latinos by Family Poverty
In terms of family poverty, the demographic groups most similar to Hispanics or Latinos are Immigrants from Guatemala (12.0%, a difference of 0.0%), Seminole (11.9%, a difference of 0.45%), Immigrants from Congo (11.9%, a difference of 0.50%), Cajun (11.9%, a difference of 0.61%), and Ute (12.1%, a difference of 0.84%).
| Demographics | Rating | Rank | Family Poverty |
| Guatemalans | 0.0 /100 | #302 | Tragic 11.7% |
| Africans | 0.0 /100 | #303 | Tragic 11.8% |
| Immigrants | Latin America | 0.0 /100 | #304 | Tragic 11.8% |
| Mexicans | 0.0 /100 | #305 | Tragic 11.8% |
| Cajuns | 0.0 /100 | #306 | Tragic 11.9% |
| Immigrants | Congo | 0.0 /100 | #307 | Tragic 11.9% |
| Seminole | 0.0 /100 | #308 | Tragic 11.9% |
| Hispanics or Latinos | 0.0 /100 | #309 | Tragic 12.0% |
| Immigrants | Guatemala | 0.0 /100 | #310 | Tragic 12.0% |
| Ute | 0.0 /100 | #311 | Tragic 12.1% |
| Immigrants | Central America | 0.0 /100 | #312 | Tragic 12.1% |
| Immigrants | Caribbean | 0.0 /100 | #313 | Tragic 12.2% |
| Kiowa | 0.0 /100 | #314 | Tragic 12.2% |
| Immigrants | Mexico | 0.0 /100 | #315 | Tragic 12.3% |
| Hondurans | 0.0 /100 | #316 | Tragic 12.4% |
Demographics Similar to Nigerians by Family Poverty
In terms of family poverty, the demographic groups most similar to Nigerians are Immigrants from Middle Africa (10.1%, a difference of 0.030%), Fijian (10.1%, a difference of 0.14%), Immigrants from Nigeria (10.2%, a difference of 0.25%), Immigrants from Sudan (10.1%, a difference of 0.39%), and Immigrants from Laos (10.2%, a difference of 0.51%).
| Demographics | Rating | Rank | Family Poverty |
| Sudanese | 3.1 /100 | #228 | Tragic 10.0% |
| Immigrants | Uzbekistan | 3.1 /100 | #229 | Tragic 10.0% |
| Immigrants | Panama | 3.1 /100 | #230 | Tragic 10.0% |
| Alaskan Athabascans | 2.7 /100 | #231 | Tragic 10.1% |
| Immigrants | Sudan | 2.3 /100 | #232 | Tragic 10.1% |
| Fijians | 2.1 /100 | #233 | Tragic 10.1% |
| Immigrants | Middle Africa | 2.1 /100 | #234 | Tragic 10.1% |
| Nigerians | 2.0 /100 | #235 | Tragic 10.1% |
| Immigrants | Nigeria | 1.9 /100 | #236 | Tragic 10.2% |
| Immigrants | Laos | 1.7 /100 | #237 | Tragic 10.2% |
| French American Indians | 1.5 /100 | #238 | Tragic 10.2% |
| Potawatomi | 1.5 /100 | #239 | Tragic 10.2% |
| Immigrants | Azores | 1.4 /100 | #240 | Tragic 10.3% |
| Ghanaians | 1.3 /100 | #241 | Tragic 10.3% |
| Alaska Natives | 1.0 /100 | #242 | Tragic 10.4% |