Hispanic or Latino vs Nepalese Family Poverty
COMPARE
Hispanic or Latino
Nepalese
Family Poverty
Family Poverty Comparison
Hispanics or Latinos
Nepalese
12.0%
FAMILY POVERTY
0.0/ 100
METRIC RATING
309th/ 347
METRIC RANK
10.4%
FAMILY POVERTY
0.8/ 100
METRIC RATING
243rd/ 347
METRIC RANK
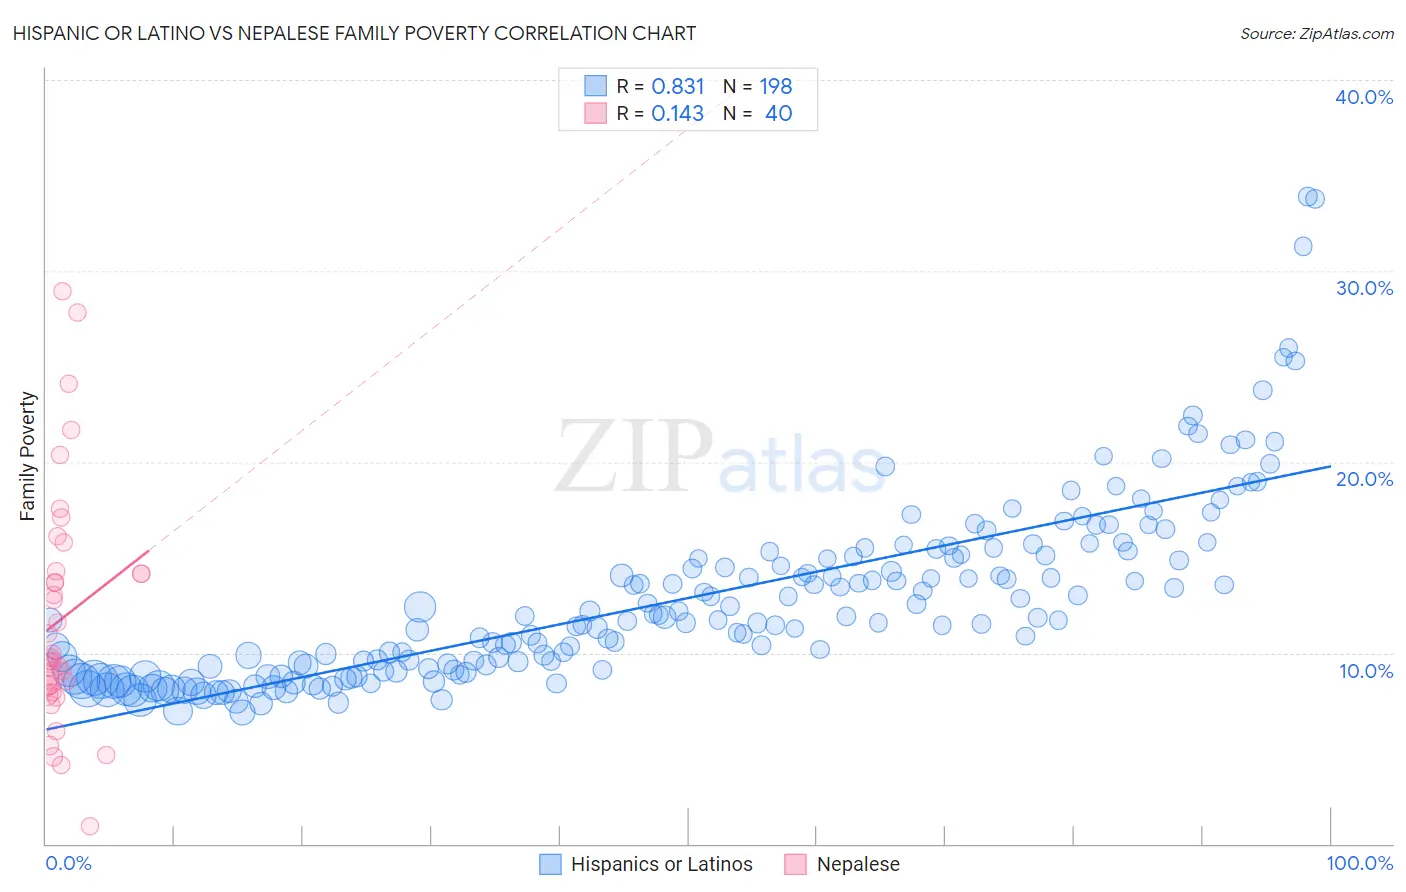
Hispanic or Latino vs Nepalese Family Poverty Correlation Chart
The statistical analysis conducted on geographies consisting of 570,393,322 people shows a very strong positive correlation between the proportion of Hispanics or Latinos and poverty level among families in the United States with a correlation coefficient (R) of 0.831 and weighted average of 12.0%. Similarly, the statistical analysis conducted on geographies consisting of 24,521,755 people shows a poor positive correlation between the proportion of Nepalese and poverty level among families in the United States with a correlation coefficient (R) of 0.143 and weighted average of 10.4%, a difference of 14.8%.
Family Poverty Correlation Summary
| Measurement | Hispanic or Latino | Nepalese |
| Minimum | 6.9% | 0.90% |
| Maximum | 33.9% | 28.9% |
| Range | 27.0% | 28.0% |
| Mean | 12.8% | 11.8% |
| Median | 11.7% | 9.7% |
| Interquartile 25% (IQ1) | 9.1% | 8.1% |
| Interquartile 75% (IQ3) | 15.0% | 14.2% |
| Interquartile Range (IQR) | 6.0% | 6.1% |
| Standard Deviation (Sample) | 4.8% | 6.2% |
| Standard Deviation (Population) | 4.7% | 6.2% |
Similar Demographics by Family Poverty
Demographics Similar to Hispanics or Latinos by Family Poverty
In terms of family poverty, the demographic groups most similar to Hispanics or Latinos are Immigrants from Guatemala (12.0%, a difference of 0.0%), Seminole (11.9%, a difference of 0.45%), Immigrants from Congo (11.9%, a difference of 0.50%), Cajun (11.9%, a difference of 0.61%), and Ute (12.1%, a difference of 0.84%).
| Demographics | Rating | Rank | Family Poverty |
| Guatemalans | 0.0 /100 | #302 | Tragic 11.7% |
| Africans | 0.0 /100 | #303 | Tragic 11.8% |
| Immigrants | Latin America | 0.0 /100 | #304 | Tragic 11.8% |
| Mexicans | 0.0 /100 | #305 | Tragic 11.8% |
| Cajuns | 0.0 /100 | #306 | Tragic 11.9% |
| Immigrants | Congo | 0.0 /100 | #307 | Tragic 11.9% |
| Seminole | 0.0 /100 | #308 | Tragic 11.9% |
| Hispanics or Latinos | 0.0 /100 | #309 | Tragic 12.0% |
| Immigrants | Guatemala | 0.0 /100 | #310 | Tragic 12.0% |
| Ute | 0.0 /100 | #311 | Tragic 12.1% |
| Immigrants | Central America | 0.0 /100 | #312 | Tragic 12.1% |
| Immigrants | Caribbean | 0.0 /100 | #313 | Tragic 12.2% |
| Kiowa | 0.0 /100 | #314 | Tragic 12.2% |
| Immigrants | Mexico | 0.0 /100 | #315 | Tragic 12.3% |
| Hondurans | 0.0 /100 | #316 | Tragic 12.4% |
Demographics Similar to Nepalese by Family Poverty
In terms of family poverty, the demographic groups most similar to Nepalese are Cree (10.5%, a difference of 0.46%), Alaska Native (10.4%, a difference of 0.48%), Immigrants from Burma/Myanmar (10.5%, a difference of 1.1%), Ghanaian (10.3%, a difference of 1.3%), and Immigrants from the Azores (10.3%, a difference of 1.4%).
| Demographics | Rating | Rank | Family Poverty |
| Immigrants | Nigeria | 1.9 /100 | #236 | Tragic 10.2% |
| Immigrants | Laos | 1.7 /100 | #237 | Tragic 10.2% |
| French American Indians | 1.5 /100 | #238 | Tragic 10.2% |
| Potawatomi | 1.5 /100 | #239 | Tragic 10.2% |
| Immigrants | Azores | 1.4 /100 | #240 | Tragic 10.3% |
| Ghanaians | 1.3 /100 | #241 | Tragic 10.3% |
| Alaska Natives | 1.0 /100 | #242 | Tragic 10.4% |
| Nepalese | 0.8 /100 | #243 | Tragic 10.4% |
| Cree | 0.7 /100 | #244 | Tragic 10.5% |
| Immigrants | Burma/Myanmar | 0.6 /100 | #245 | Tragic 10.5% |
| Cherokee | 0.5 /100 | #246 | Tragic 10.6% |
| Liberians | 0.4 /100 | #247 | Tragic 10.6% |
| Nicaraguans | 0.4 /100 | #248 | Tragic 10.6% |
| Cubans | 0.4 /100 | #249 | Tragic 10.6% |
| Salvadorans | 0.3 /100 | #250 | Tragic 10.7% |