European vs Honduran Male Poverty
COMPARE
European
Honduran
Male Poverty
Male Poverty Comparison
Europeans
Hondurans
10.2%
MALE POVERTY
97.1/ 100
METRIC RATING
71st/ 347
METRIC RANK
14.3%
MALE POVERTY
0.0/ 100
METRIC RATING
311th/ 347
METRIC RANK
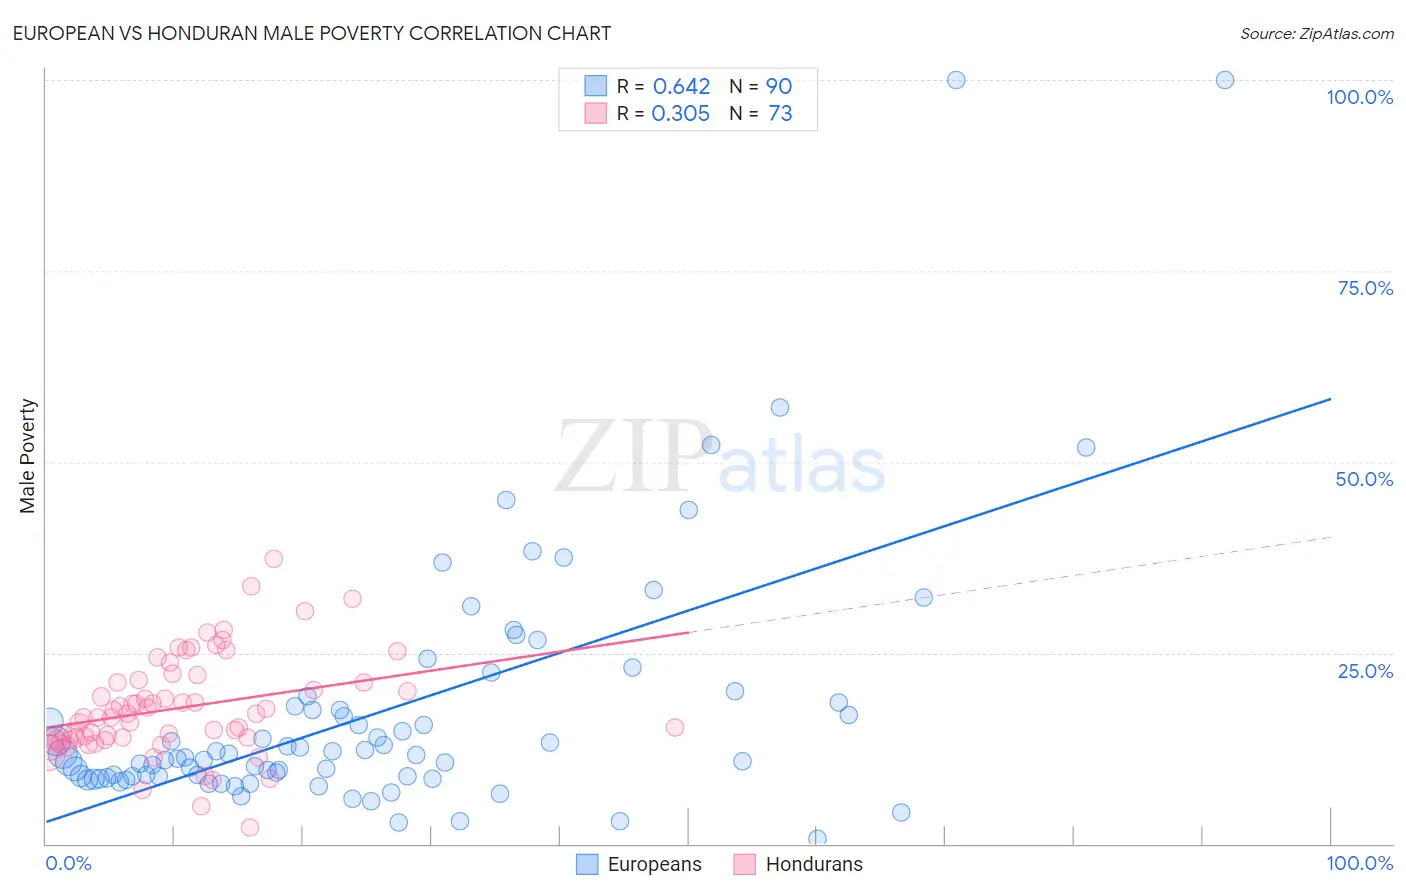
European vs Honduran Male Poverty Correlation Chart
The statistical analysis conducted on geographies consisting of 560,421,320 people shows a significant positive correlation between the proportion of Europeans and poverty level among males in the United States with a correlation coefficient (R) of 0.642 and weighted average of 10.2%. Similarly, the statistical analysis conducted on geographies consisting of 357,543,149 people shows a mild positive correlation between the proportion of Hondurans and poverty level among males in the United States with a correlation coefficient (R) of 0.305 and weighted average of 14.3%, a difference of 40.0%.
Male Poverty Correlation Summary
| Measurement | European | Honduran |
| Minimum | 0.73% | 2.2% |
| Maximum | 100.0% | 37.3% |
| Range | 99.3% | 35.2% |
| Mean | 17.4% | 17.7% |
| Median | 11.4% | 16.5% |
| Interquartile 25% (IQ1) | 8.8% | 13.7% |
| Interquartile 75% (IQ3) | 18.1% | 21.3% |
| Interquartile Range (IQR) | 9.3% | 7.6% |
| Standard Deviation (Sample) | 17.0% | 6.5% |
| Standard Deviation (Population) | 16.9% | 6.5% |
Similar Demographics by Male Poverty
Demographics Similar to Europeans by Male Poverty
In terms of male poverty, the demographic groups most similar to Europeans are Immigrants from Canada (10.2%, a difference of 0.010%), Paraguayan (10.2%, a difference of 0.030%), Immigrants from Australia (10.2%, a difference of 0.040%), Immigrants from Asia (10.2%, a difference of 0.090%), and Immigrants from Eastern Europe (10.2%, a difference of 0.16%).
| Demographics | Rating | Rank | Male Poverty |
| Swiss | 97.5 /100 | #64 | Exceptional 10.2% |
| Zimbabweans | 97.5 /100 | #65 | Exceptional 10.2% |
| Serbians | 97.5 /100 | #66 | Exceptional 10.2% |
| Immigrants | Netherlands | 97.3 /100 | #67 | Exceptional 10.2% |
| Immigrants | Sri Lanka | 97.2 /100 | #68 | Exceptional 10.2% |
| Immigrants | Australia | 97.1 /100 | #69 | Exceptional 10.2% |
| Paraguayans | 97.1 /100 | #70 | Exceptional 10.2% |
| Europeans | 97.1 /100 | #71 | Exceptional 10.2% |
| Immigrants | Canada | 97.1 /100 | #72 | Exceptional 10.2% |
| Immigrants | Asia | 97.0 /100 | #73 | Exceptional 10.2% |
| Immigrants | Eastern Europe | 96.9 /100 | #74 | Exceptional 10.2% |
| Carpatho Rusyns | 96.9 /100 | #75 | Exceptional 10.2% |
| Dutch | 96.9 /100 | #76 | Exceptional 10.2% |
| Immigrants | Belgium | 96.8 /100 | #77 | Exceptional 10.3% |
| Irish | 96.8 /100 | #78 | Exceptional 10.3% |
Demographics Similar to Hondurans by Male Poverty
In terms of male poverty, the demographic groups most similar to Hondurans are Seminole (14.3%, a difference of 0.21%), Somali (14.3%, a difference of 0.41%), Choctaw (14.4%, a difference of 0.47%), African (14.2%, a difference of 0.79%), and Dutch West Indian (14.2%, a difference of 0.81%).
| Demographics | Rating | Rank | Male Poverty |
| Senegalese | 0.0 /100 | #304 | Tragic 14.1% |
| Immigrants | Bangladesh | 0.0 /100 | #305 | Tragic 14.1% |
| Creek | 0.0 /100 | #306 | Tragic 14.1% |
| Dutch West Indians | 0.0 /100 | #307 | Tragic 14.2% |
| Africans | 0.0 /100 | #308 | Tragic 14.2% |
| Somalis | 0.0 /100 | #309 | Tragic 14.3% |
| Seminole | 0.0 /100 | #310 | Tragic 14.3% |
| Hondurans | 0.0 /100 | #311 | Tragic 14.3% |
| Choctaw | 0.0 /100 | #312 | Tragic 14.4% |
| Immigrants | Somalia | 0.0 /100 | #313 | Tragic 14.6% |
| Immigrants | Honduras | 0.0 /100 | #314 | Tragic 14.6% |
| Chippewa | 0.0 /100 | #315 | Tragic 14.6% |
| British West Indians | 0.0 /100 | #316 | Tragic 14.6% |
| Immigrants | Dominica | 0.0 /100 | #317 | Tragic 14.7% |
| Immigrants | Grenada | 0.0 /100 | #318 | Tragic 14.7% |