Immigrants from Pakistan vs Honduran Male Poverty
COMPARE
Immigrants from Pakistan
Honduran
Male Poverty
Male Poverty Comparison
Immigrants from Pakistan
Hondurans
9.9%
MALE POVERTY
99.2/ 100
METRIC RATING
38th/ 347
METRIC RANK
14.3%
MALE POVERTY
0.0/ 100
METRIC RATING
311th/ 347
METRIC RANK
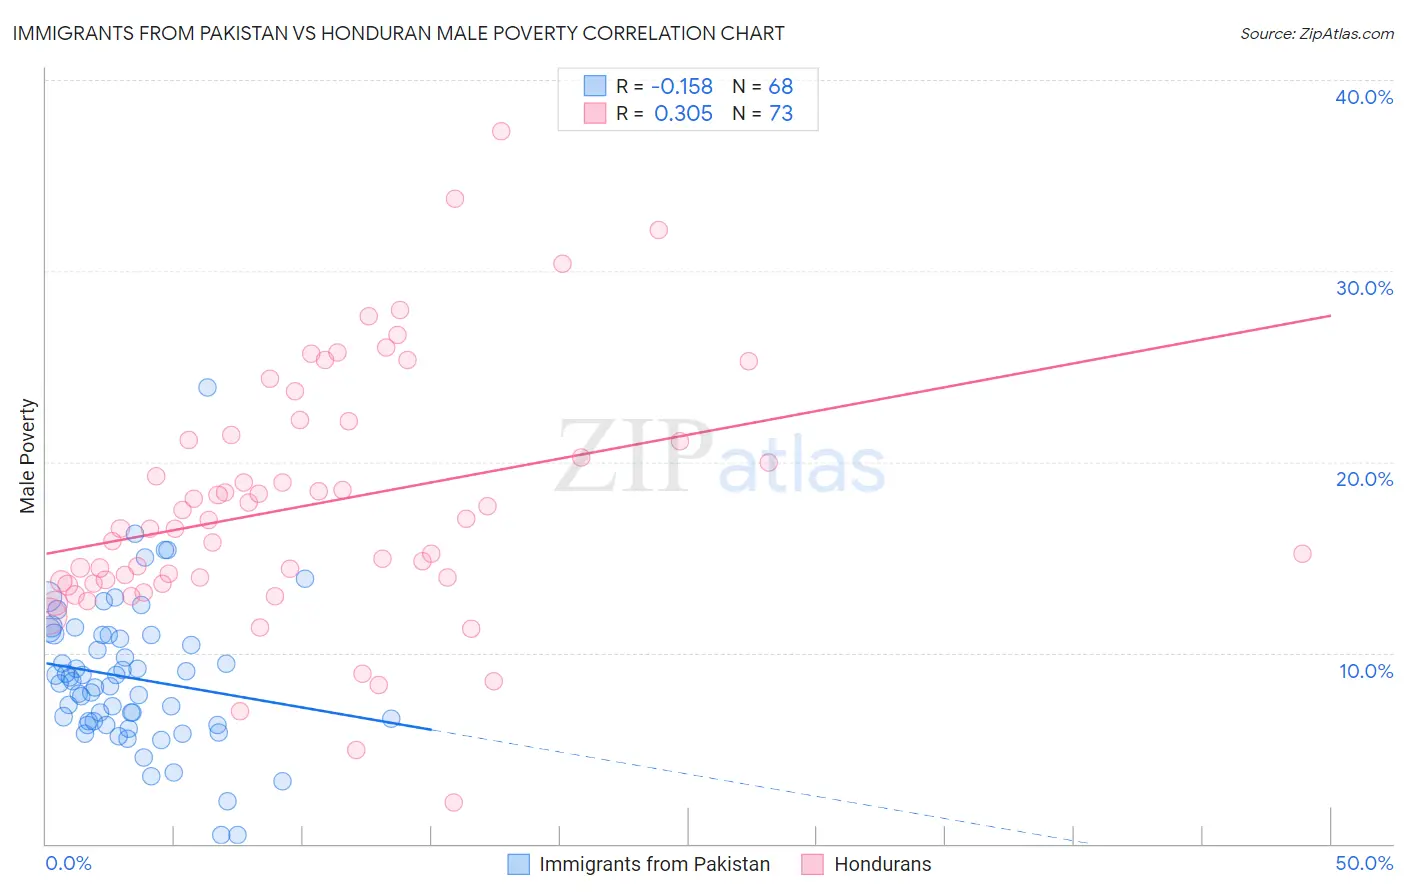
Immigrants from Pakistan vs Honduran Male Poverty Correlation Chart
The statistical analysis conducted on geographies consisting of 283,757,026 people shows a poor negative correlation between the proportion of Immigrants from Pakistan and poverty level among males in the United States with a correlation coefficient (R) of -0.158 and weighted average of 9.9%. Similarly, the statistical analysis conducted on geographies consisting of 357,543,149 people shows a mild positive correlation between the proportion of Hondurans and poverty level among males in the United States with a correlation coefficient (R) of 0.305 and weighted average of 14.3%, a difference of 45.3%.
Male Poverty Correlation Summary
| Measurement | Immigrants from Pakistan | Honduran |
| Minimum | 0.49% | 2.2% |
| Maximum | 23.9% | 37.3% |
| Range | 23.4% | 35.2% |
| Mean | 8.7% | 17.7% |
| Median | 8.5% | 16.5% |
| Interquartile 25% (IQ1) | 6.3% | 13.7% |
| Interquartile 75% (IQ3) | 10.9% | 21.3% |
| Interquartile Range (IQR) | 4.6% | 7.6% |
| Standard Deviation (Sample) | 3.8% | 6.5% |
| Standard Deviation (Population) | 3.8% | 6.5% |
Similar Demographics by Male Poverty
Demographics Similar to Immigrants from Pakistan by Male Poverty
In terms of male poverty, the demographic groups most similar to Immigrants from Pakistan are Russian (9.9%, a difference of 0.010%), Cypriot (9.9%, a difference of 0.090%), Korean (9.9%, a difference of 0.18%), Immigrants from Greece (9.8%, a difference of 0.37%), and Immigrants from Iran (9.9%, a difference of 0.42%).
| Demographics | Rating | Rank | Male Poverty |
| Tongans | 99.5 /100 | #31 | Exceptional 9.7% |
| Macedonians | 99.5 /100 | #32 | Exceptional 9.7% |
| Immigrants | Northern Europe | 99.5 /100 | #33 | Exceptional 9.7% |
| Immigrants | Poland | 99.5 /100 | #34 | Exceptional 9.8% |
| Iranians | 99.4 /100 | #35 | Exceptional 9.8% |
| Czechs | 99.4 /100 | #36 | Exceptional 9.8% |
| Immigrants | Greece | 99.3 /100 | #37 | Exceptional 9.8% |
| Immigrants | Pakistan | 99.2 /100 | #38 | Exceptional 9.9% |
| Russians | 99.2 /100 | #39 | Exceptional 9.9% |
| Cypriots | 99.2 /100 | #40 | Exceptional 9.9% |
| Koreans | 99.2 /100 | #41 | Exceptional 9.9% |
| Immigrants | Iran | 99.1 /100 | #42 | Exceptional 9.9% |
| Immigrants | Moldova | 99.0 /100 | #43 | Exceptional 9.9% |
| Immigrants | Romania | 98.9 /100 | #44 | Exceptional 9.9% |
| Immigrants | Serbia | 98.9 /100 | #45 | Exceptional 10.0% |
Demographics Similar to Hondurans by Male Poverty
In terms of male poverty, the demographic groups most similar to Hondurans are Seminole (14.3%, a difference of 0.21%), Somali (14.3%, a difference of 0.41%), Choctaw (14.4%, a difference of 0.47%), African (14.2%, a difference of 0.79%), and Dutch West Indian (14.2%, a difference of 0.81%).
| Demographics | Rating | Rank | Male Poverty |
| Senegalese | 0.0 /100 | #304 | Tragic 14.1% |
| Immigrants | Bangladesh | 0.0 /100 | #305 | Tragic 14.1% |
| Creek | 0.0 /100 | #306 | Tragic 14.1% |
| Dutch West Indians | 0.0 /100 | #307 | Tragic 14.2% |
| Africans | 0.0 /100 | #308 | Tragic 14.2% |
| Somalis | 0.0 /100 | #309 | Tragic 14.3% |
| Seminole | 0.0 /100 | #310 | Tragic 14.3% |
| Hondurans | 0.0 /100 | #311 | Tragic 14.3% |
| Choctaw | 0.0 /100 | #312 | Tragic 14.4% |
| Immigrants | Somalia | 0.0 /100 | #313 | Tragic 14.6% |
| Immigrants | Honduras | 0.0 /100 | #314 | Tragic 14.6% |
| Chippewa | 0.0 /100 | #315 | Tragic 14.6% |
| British West Indians | 0.0 /100 | #316 | Tragic 14.6% |
| Immigrants | Dominica | 0.0 /100 | #317 | Tragic 14.7% |
| Immigrants | Grenada | 0.0 /100 | #318 | Tragic 14.7% |