Colombian vs Honduran Male Poverty
COMPARE
Colombian
Honduran
Male Poverty
Male Poverty Comparison
Colombians
Hondurans
11.0%
MALE POVERTY
63.0/ 100
METRIC RATING
158th/ 347
METRIC RANK
14.3%
MALE POVERTY
0.0/ 100
METRIC RATING
311th/ 347
METRIC RANK
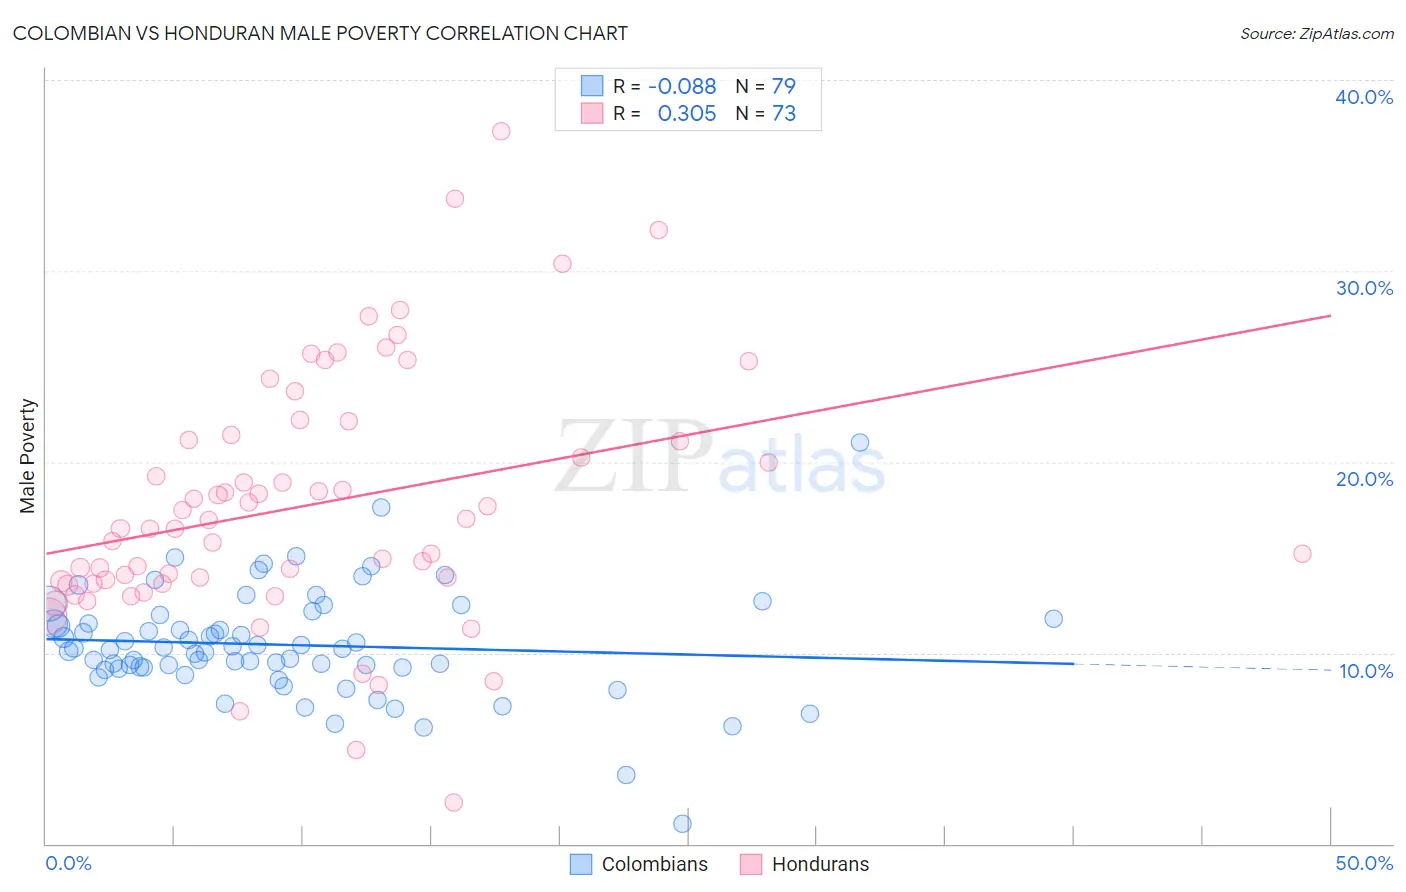
Colombian vs Honduran Male Poverty Correlation Chart
The statistical analysis conducted on geographies consisting of 419,146,336 people shows a slight negative correlation between the proportion of Colombians and poverty level among males in the United States with a correlation coefficient (R) of -0.088 and weighted average of 11.0%. Similarly, the statistical analysis conducted on geographies consisting of 357,543,149 people shows a mild positive correlation between the proportion of Hondurans and poverty level among males in the United States with a correlation coefficient (R) of 0.305 and weighted average of 14.3%, a difference of 29.7%.
Male Poverty Correlation Summary
| Measurement | Colombian | Honduran |
| Minimum | 1.0% | 2.2% |
| Maximum | 21.0% | 37.3% |
| Range | 20.0% | 35.2% |
| Mean | 10.4% | 17.7% |
| Median | 10.2% | 16.5% |
| Interquartile 25% (IQ1) | 9.2% | 13.7% |
| Interquartile 75% (IQ3) | 11.8% | 21.3% |
| Interquartile Range (IQR) | 2.5% | 7.6% |
| Standard Deviation (Sample) | 2.9% | 6.5% |
| Standard Deviation (Population) | 2.9% | 6.5% |
Similar Demographics by Male Poverty
Demographics Similar to Colombians by Male Poverty
In terms of male poverty, the demographic groups most similar to Colombians are Taiwanese (11.0%, a difference of 0.030%), Scotch-Irish (11.0%, a difference of 0.080%), Costa Rican (11.0%, a difference of 0.10%), Immigrants from Malaysia (11.0%, a difference of 0.19%), and Immigrants from Kazakhstan (11.0%, a difference of 0.20%).
| Demographics | Rating | Rank | Male Poverty |
| Venezuelans | 67.4 /100 | #151 | Good 11.0% |
| Immigrants | Nepal | 67.3 /100 | #152 | Good 11.0% |
| Immigrants | Bosnia and Herzegovina | 65.2 /100 | #153 | Good 11.0% |
| Immigrants | Kazakhstan | 64.8 /100 | #154 | Good 11.0% |
| Immigrants | Malaysia | 64.7 /100 | #155 | Good 11.0% |
| Costa Ricans | 63.9 /100 | #156 | Good 11.0% |
| Scotch-Irish | 63.7 /100 | #157 | Good 11.0% |
| Colombians | 63.0 /100 | #158 | Good 11.0% |
| Taiwanese | 62.7 /100 | #159 | Good 11.0% |
| Soviet Union | 60.3 /100 | #160 | Good 11.1% |
| Immigrants | Northern Africa | 59.7 /100 | #161 | Average 11.1% |
| Immigrants | Chile | 57.4 /100 | #162 | Average 11.1% |
| Whites/Caucasians | 56.7 /100 | #163 | Average 11.1% |
| Ethiopians | 56.7 /100 | #164 | Average 11.1% |
| Immigrants | Spain | 55.5 /100 | #165 | Average 11.1% |
Demographics Similar to Hondurans by Male Poverty
In terms of male poverty, the demographic groups most similar to Hondurans are Seminole (14.3%, a difference of 0.21%), Somali (14.3%, a difference of 0.41%), Choctaw (14.4%, a difference of 0.47%), African (14.2%, a difference of 0.79%), and Dutch West Indian (14.2%, a difference of 0.81%).
| Demographics | Rating | Rank | Male Poverty |
| Senegalese | 0.0 /100 | #304 | Tragic 14.1% |
| Immigrants | Bangladesh | 0.0 /100 | #305 | Tragic 14.1% |
| Creek | 0.0 /100 | #306 | Tragic 14.1% |
| Dutch West Indians | 0.0 /100 | #307 | Tragic 14.2% |
| Africans | 0.0 /100 | #308 | Tragic 14.2% |
| Somalis | 0.0 /100 | #309 | Tragic 14.3% |
| Seminole | 0.0 /100 | #310 | Tragic 14.3% |
| Hondurans | 0.0 /100 | #311 | Tragic 14.3% |
| Choctaw | 0.0 /100 | #312 | Tragic 14.4% |
| Immigrants | Somalia | 0.0 /100 | #313 | Tragic 14.6% |
| Immigrants | Honduras | 0.0 /100 | #314 | Tragic 14.6% |
| Chippewa | 0.0 /100 | #315 | Tragic 14.6% |
| British West Indians | 0.0 /100 | #316 | Tragic 14.6% |
| Immigrants | Dominica | 0.0 /100 | #317 | Tragic 14.7% |
| Immigrants | Grenada | 0.0 /100 | #318 | Tragic 14.7% |