Haitian vs Honduran Male Poverty
COMPARE
Haitian
Honduran
Male Poverty
Male Poverty Comparison
Haitians
Hondurans
13.7%
MALE POVERTY
0.0/ 100
METRIC RATING
279th/ 347
METRIC RANK
14.3%
MALE POVERTY
0.0/ 100
METRIC RATING
311th/ 347
METRIC RANK
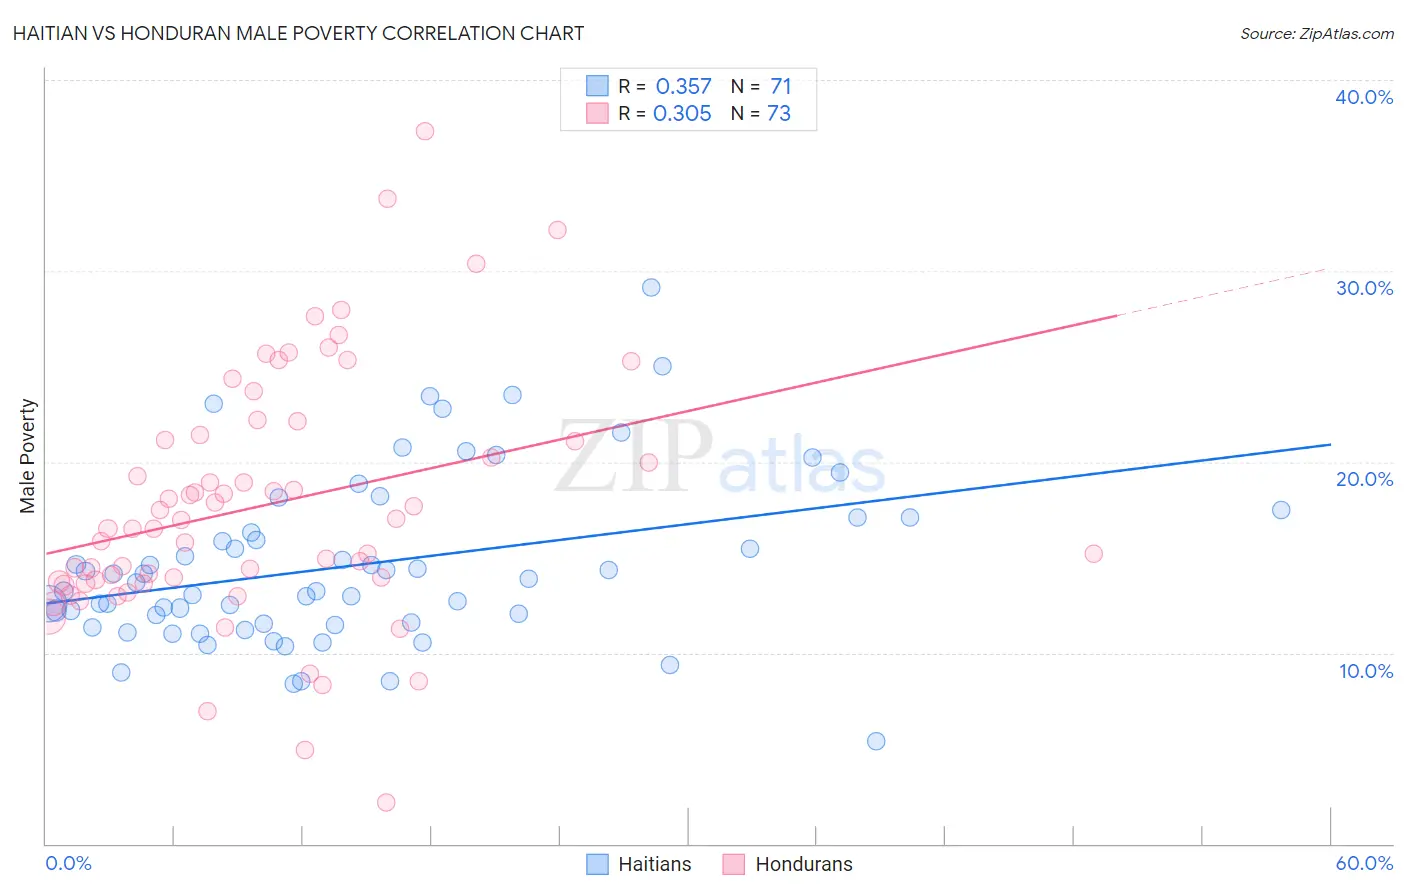
Haitian vs Honduran Male Poverty Correlation Chart
The statistical analysis conducted on geographies consisting of 287,676,273 people shows a mild positive correlation between the proportion of Haitians and poverty level among males in the United States with a correlation coefficient (R) of 0.357 and weighted average of 13.7%. Similarly, the statistical analysis conducted on geographies consisting of 357,543,149 people shows a mild positive correlation between the proportion of Hondurans and poverty level among males in the United States with a correlation coefficient (R) of 0.305 and weighted average of 14.3%, a difference of 4.8%.
Male Poverty Correlation Summary
| Measurement | Haitian | Honduran |
| Minimum | 5.4% | 2.2% |
| Maximum | 29.1% | 37.3% |
| Range | 23.8% | 35.2% |
| Mean | 14.6% | 17.7% |
| Median | 13.7% | 16.5% |
| Interquartile 25% (IQ1) | 11.5% | 13.7% |
| Interquartile 75% (IQ3) | 17.1% | 21.3% |
| Interquartile Range (IQR) | 5.5% | 7.6% |
| Standard Deviation (Sample) | 4.5% | 6.5% |
| Standard Deviation (Population) | 4.4% | 6.5% |
Similar Demographics by Male Poverty
Demographics Similar to Haitians by Male Poverty
In terms of male poverty, the demographic groups most similar to Haitians are Mexican (13.7%, a difference of 0.090%), Yaqui (13.7%, a difference of 0.14%), Belizean (13.6%, a difference of 0.18%), Bangladeshi (13.6%, a difference of 0.27%), and Immigrants from Cabo Verde (13.7%, a difference of 0.41%).
| Demographics | Rating | Rank | Male Poverty |
| Immigrants | Bahamas | 0.0 /100 | #272 | Tragic 13.5% |
| Chickasaw | 0.0 /100 | #273 | Tragic 13.5% |
| Immigrants | West Indies | 0.0 /100 | #274 | Tragic 13.5% |
| Barbadians | 0.0 /100 | #275 | Tragic 13.6% |
| Immigrants | Latin America | 0.0 /100 | #276 | Tragic 13.6% |
| Bangladeshis | 0.0 /100 | #277 | Tragic 13.6% |
| Belizeans | 0.0 /100 | #278 | Tragic 13.6% |
| Haitians | 0.0 /100 | #279 | Tragic 13.7% |
| Mexicans | 0.0 /100 | #280 | Tragic 13.7% |
| Yaqui | 0.0 /100 | #281 | Tragic 13.7% |
| Immigrants | Cabo Verde | 0.0 /100 | #282 | Tragic 13.7% |
| Comanche | 0.0 /100 | #283 | Tragic 13.8% |
| Immigrants | Haiti | 0.0 /100 | #284 | Tragic 13.8% |
| West Indians | 0.0 /100 | #285 | Tragic 13.8% |
| Shoshone | 0.0 /100 | #286 | Tragic 13.8% |
Demographics Similar to Hondurans by Male Poverty
In terms of male poverty, the demographic groups most similar to Hondurans are Seminole (14.3%, a difference of 0.21%), Somali (14.3%, a difference of 0.41%), Choctaw (14.4%, a difference of 0.47%), African (14.2%, a difference of 0.79%), and Dutch West Indian (14.2%, a difference of 0.81%).
| Demographics | Rating | Rank | Male Poverty |
| Senegalese | 0.0 /100 | #304 | Tragic 14.1% |
| Immigrants | Bangladesh | 0.0 /100 | #305 | Tragic 14.1% |
| Creek | 0.0 /100 | #306 | Tragic 14.1% |
| Dutch West Indians | 0.0 /100 | #307 | Tragic 14.2% |
| Africans | 0.0 /100 | #308 | Tragic 14.2% |
| Somalis | 0.0 /100 | #309 | Tragic 14.3% |
| Seminole | 0.0 /100 | #310 | Tragic 14.3% |
| Hondurans | 0.0 /100 | #311 | Tragic 14.3% |
| Choctaw | 0.0 /100 | #312 | Tragic 14.4% |
| Immigrants | Somalia | 0.0 /100 | #313 | Tragic 14.6% |
| Immigrants | Honduras | 0.0 /100 | #314 | Tragic 14.6% |
| Chippewa | 0.0 /100 | #315 | Tragic 14.6% |
| British West Indians | 0.0 /100 | #316 | Tragic 14.6% |
| Immigrants | Dominica | 0.0 /100 | #317 | Tragic 14.7% |
| Immigrants | Grenada | 0.0 /100 | #318 | Tragic 14.7% |