Immigrants from Korea vs Chilean Female Poverty
COMPARE
Immigrants from Korea
Chilean
Female Poverty
Female Poverty Comparison
Immigrants from Korea
Chileans
11.7%
FEMALE POVERTY
99.6/ 100
METRIC RATING
28th/ 347
METRIC RANK
12.9%
FEMALE POVERTY
84.7/ 100
METRIC RATING
137th/ 347
METRIC RANK
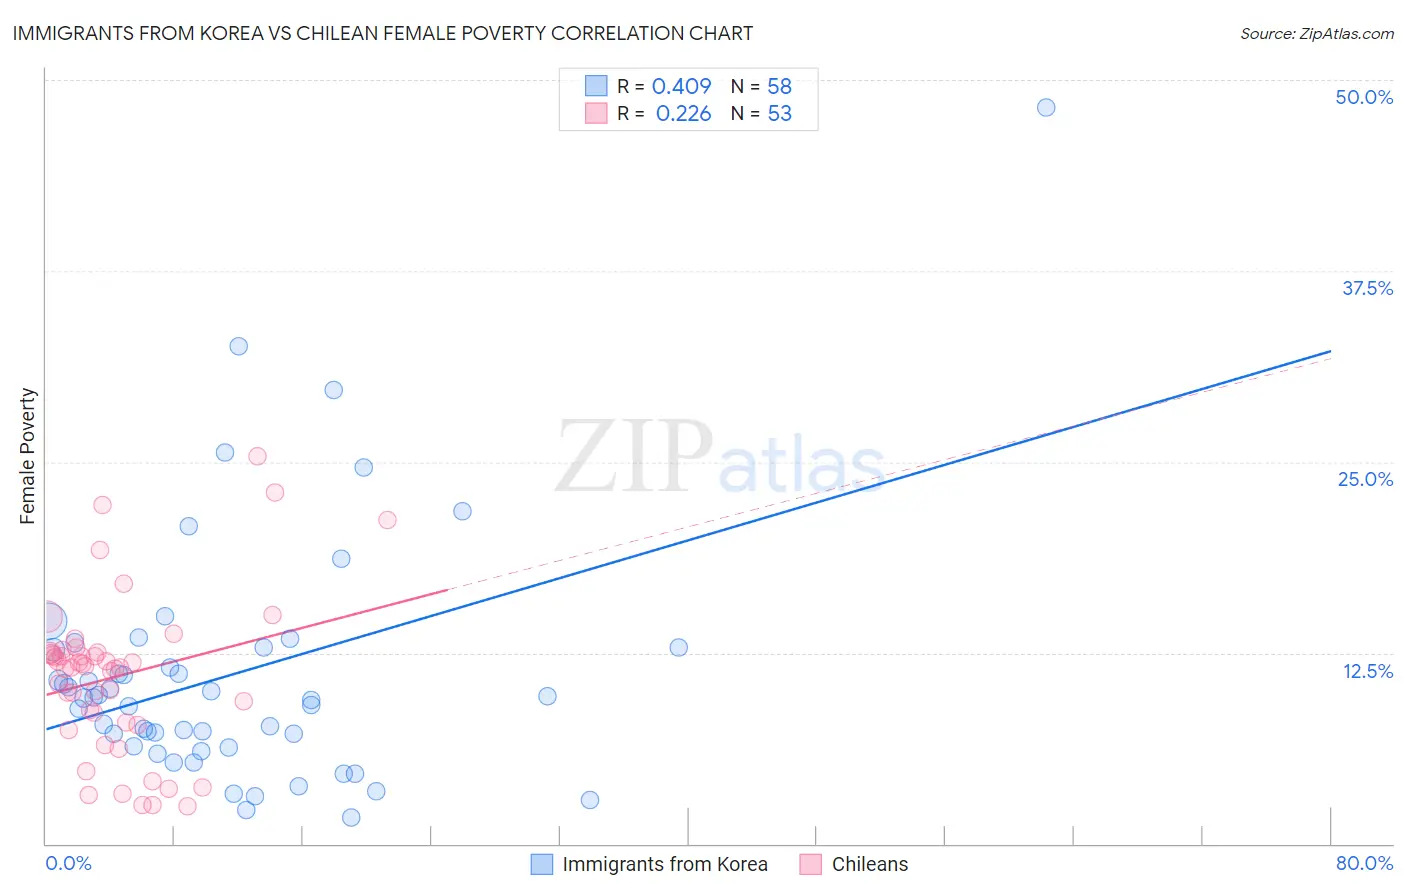
Immigrants from Korea vs Chilean Female Poverty Correlation Chart
The statistical analysis conducted on geographies consisting of 415,882,145 people shows a moderate positive correlation between the proportion of Immigrants from Korea and poverty level among females in the United States with a correlation coefficient (R) of 0.409 and weighted average of 11.7%. Similarly, the statistical analysis conducted on geographies consisting of 256,534,344 people shows a weak positive correlation between the proportion of Chileans and poverty level among females in the United States with a correlation coefficient (R) of 0.226 and weighted average of 12.9%, a difference of 10.4%.
Female Poverty Correlation Summary
| Measurement | Immigrants from Korea | Chilean |
| Minimum | 1.7% | 2.5% |
| Maximum | 48.2% | 25.4% |
| Range | 46.5% | 22.9% |
| Mean | 11.1% | 11.0% |
| Median | 9.6% | 11.6% |
| Interquartile 25% (IQ1) | 6.4% | 7.8% |
| Interquartile 75% (IQ3) | 12.8% | 12.5% |
| Interquartile Range (IQR) | 6.5% | 4.7% |
| Standard Deviation (Sample) | 8.1% | 5.2% |
| Standard Deviation (Population) | 8.1% | 5.1% |
Similar Demographics by Female Poverty
Demographics Similar to Immigrants from Korea by Female Poverty
In terms of female poverty, the demographic groups most similar to Immigrants from Korea are Immigrants from North Macedonia (11.7%, a difference of 0.15%), Iranian (11.7%, a difference of 0.21%), Greek (11.7%, a difference of 0.23%), Immigrants from Northern Europe (11.6%, a difference of 0.32%), and Croatian (11.6%, a difference of 0.32%).
| Demographics | Rating | Rank | Female Poverty |
| Italians | 99.7 /100 | #21 | Exceptional 11.6% |
| Swedes | 99.7 /100 | #22 | Exceptional 11.6% |
| Burmese | 99.7 /100 | #23 | Exceptional 11.6% |
| Luxembourgers | 99.7 /100 | #24 | Exceptional 11.6% |
| Immigrants | Northern Europe | 99.6 /100 | #25 | Exceptional 11.6% |
| Croatians | 99.6 /100 | #26 | Exceptional 11.6% |
| Iranians | 99.6 /100 | #27 | Exceptional 11.7% |
| Immigrants | Korea | 99.6 /100 | #28 | Exceptional 11.7% |
| Immigrants | North Macedonia | 99.6 /100 | #29 | Exceptional 11.7% |
| Greeks | 99.5 /100 | #30 | Exceptional 11.7% |
| Poles | 99.5 /100 | #31 | Exceptional 11.7% |
| Danes | 99.5 /100 | #32 | Exceptional 11.7% |
| Cypriots | 99.5 /100 | #33 | Exceptional 11.8% |
| Immigrants | Singapore | 99.4 /100 | #34 | Exceptional 11.8% |
| Immigrants | Iran | 99.4 /100 | #35 | Exceptional 11.8% |
Demographics Similar to Chileans by Female Poverty
In terms of female poverty, the demographic groups most similar to Chileans are Peruvian (12.9%, a difference of 0.090%), French (12.9%, a difference of 0.17%), Immigrants from Switzerland (12.9%, a difference of 0.22%), Immigrants from France (12.9%, a difference of 0.22%), and Basque (12.9%, a difference of 0.31%).
| Demographics | Rating | Rank | Female Poverty |
| Immigrants | Vietnam | 87.1 /100 | #130 | Excellent 12.8% |
| Immigrants | Argentina | 87.0 /100 | #131 | Excellent 12.8% |
| Immigrants | Jordan | 86.9 /100 | #132 | Excellent 12.8% |
| Immigrants | Western Europe | 86.6 /100 | #133 | Excellent 12.8% |
| Immigrants | Switzerland | 85.8 /100 | #134 | Excellent 12.9% |
| French | 85.6 /100 | #135 | Excellent 12.9% |
| Peruvians | 85.2 /100 | #136 | Excellent 12.9% |
| Chileans | 84.7 /100 | #137 | Excellent 12.9% |
| Immigrants | France | 83.6 /100 | #138 | Excellent 12.9% |
| Basques | 83.1 /100 | #139 | Excellent 12.9% |
| Pakistanis | 83.0 /100 | #140 | Excellent 12.9% |
| Icelanders | 81.1 /100 | #141 | Excellent 13.0% |
| Brazilians | 80.5 /100 | #142 | Excellent 13.0% |
| Immigrants | Malaysia | 80.4 /100 | #143 | Excellent 13.0% |
| Afghans | 79.8 /100 | #144 | Good 13.0% |