Hawaiian vs Immigrants from Bangladesh Male Poverty
COMPARE
Hawaiian
Immigrants from Bangladesh
Male Poverty
Male Poverty Comparison
Hawaiians
Immigrants from Bangladesh
11.4%
MALE POVERTY
28.3/ 100
METRIC RATING
189th/ 347
METRIC RANK
14.1%
MALE POVERTY
0.0/ 100
METRIC RATING
305th/ 347
METRIC RANK
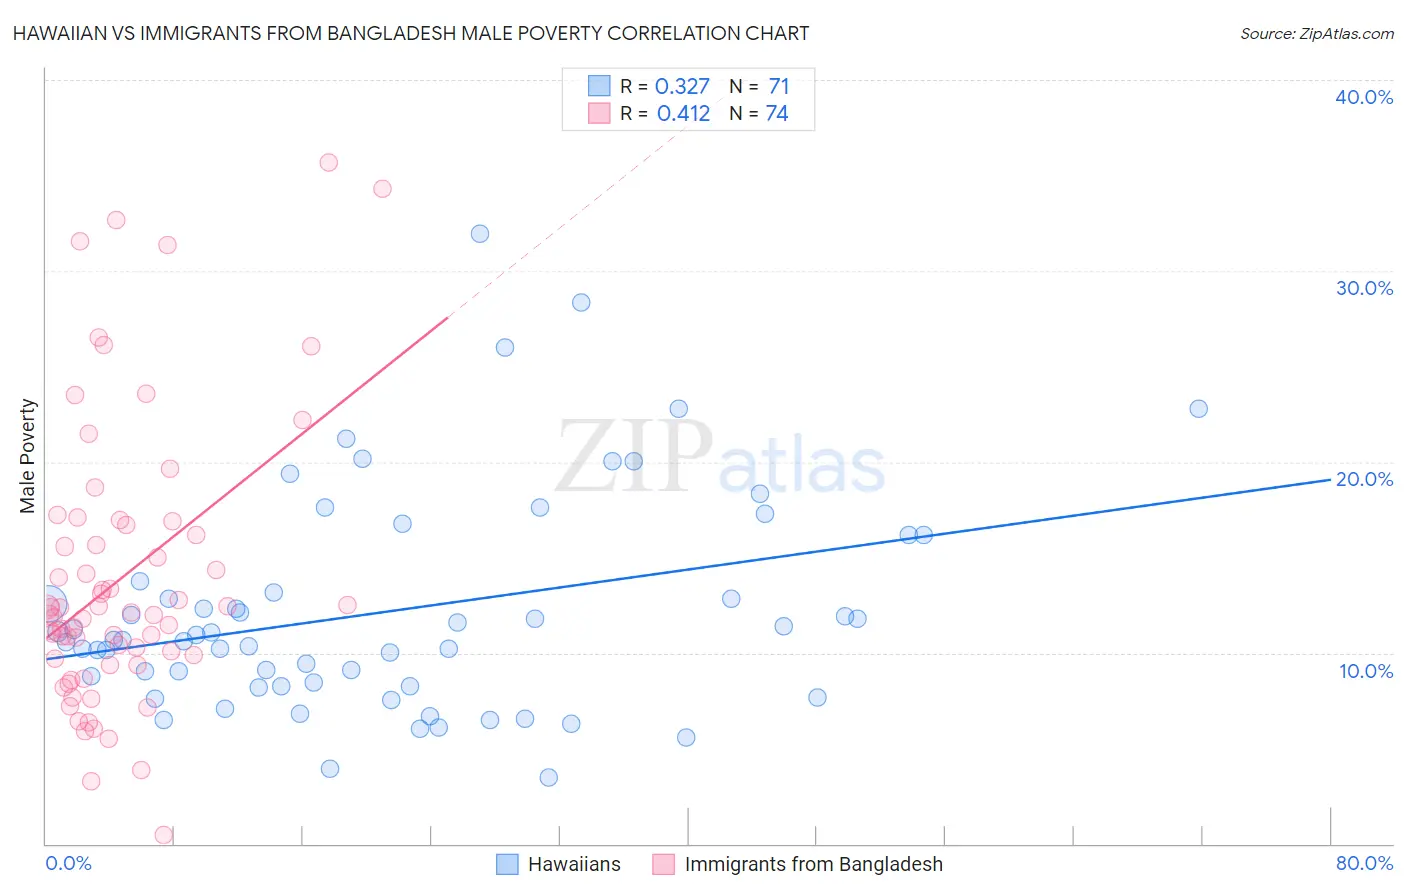
Hawaiian vs Immigrants from Bangladesh Male Poverty Correlation Chart
The statistical analysis conducted on geographies consisting of 327,329,663 people shows a mild positive correlation between the proportion of Hawaiians and poverty level among males in the United States with a correlation coefficient (R) of 0.327 and weighted average of 11.4%. Similarly, the statistical analysis conducted on geographies consisting of 203,544,271 people shows a moderate positive correlation between the proportion of Immigrants from Bangladesh and poverty level among males in the United States with a correlation coefficient (R) of 0.412 and weighted average of 14.1%, a difference of 23.2%.
Male Poverty Correlation Summary
| Measurement | Hawaiian | Immigrants from Bangladesh |
| Minimum | 3.5% | 0.44% |
| Maximum | 31.9% | 35.7% |
| Range | 28.5% | 35.2% |
| Mean | 12.2% | 13.9% |
| Median | 10.7% | 12.1% |
| Interquartile 25% (IQ1) | 8.3% | 9.7% |
| Interquartile 75% (IQ3) | 13.7% | 16.7% |
| Interquartile Range (IQR) | 5.4% | 7.0% |
| Standard Deviation (Sample) | 5.7% | 7.4% |
| Standard Deviation (Population) | 5.7% | 7.3% |
Similar Demographics by Male Poverty
Demographics Similar to Hawaiians by Male Poverty
In terms of male poverty, the demographic groups most similar to Hawaiians are Sierra Leonean (11.4%, a difference of 0.18%), Israeli (11.5%, a difference of 0.26%), Immigrants from Iraq (11.4%, a difference of 0.41%), Immigrants from Sierra Leone (11.4%, a difference of 0.52%), and Immigrants from Afghanistan (11.4%, a difference of 0.57%).
| Demographics | Rating | Rank | Male Poverty |
| Mongolians | 39.0 /100 | #182 | Fair 11.3% |
| Kenyans | 38.4 /100 | #183 | Fair 11.3% |
| Immigrants | South America | 36.9 /100 | #184 | Fair 11.3% |
| Immigrants | Afghanistan | 33.3 /100 | #185 | Fair 11.4% |
| Immigrants | Sierra Leone | 32.9 /100 | #186 | Fair 11.4% |
| Immigrants | Iraq | 31.9 /100 | #187 | Fair 11.4% |
| Sierra Leoneans | 29.9 /100 | #188 | Fair 11.4% |
| Hawaiians | 28.3 /100 | #189 | Fair 11.4% |
| Israelis | 26.1 /100 | #190 | Fair 11.5% |
| South American Indians | 22.8 /100 | #191 | Fair 11.5% |
| Immigrants | Uruguay | 19.1 /100 | #192 | Poor 11.6% |
| Immigrants | Kuwait | 17.3 /100 | #193 | Poor 11.6% |
| Immigrants | Kenya | 16.1 /100 | #194 | Poor 11.6% |
| Arabs | 15.8 /100 | #195 | Poor 11.6% |
| Hmong | 15.8 /100 | #196 | Poor 11.6% |
Demographics Similar to Immigrants from Bangladesh by Male Poverty
In terms of male poverty, the demographic groups most similar to Immigrants from Bangladesh are Creek (14.1%, a difference of 0.070%), Senegalese (14.1%, a difference of 0.21%), Bahamian (14.1%, a difference of 0.32%), Immigrants from Caribbean (14.0%, a difference of 0.36%), and Immigrants from Senegal (14.0%, a difference of 0.42%).
| Demographics | Rating | Rank | Male Poverty |
| Blackfeet | 0.0 /100 | #298 | Tragic 14.0% |
| Immigrants | Guatemala | 0.0 /100 | #299 | Tragic 14.0% |
| Immigrants | Mexico | 0.0 /100 | #300 | Tragic 14.0% |
| Immigrants | Senegal | 0.0 /100 | #301 | Tragic 14.0% |
| Immigrants | Caribbean | 0.0 /100 | #302 | Tragic 14.0% |
| Bahamians | 0.0 /100 | #303 | Tragic 14.1% |
| Senegalese | 0.0 /100 | #304 | Tragic 14.1% |
| Immigrants | Bangladesh | 0.0 /100 | #305 | Tragic 14.1% |
| Creek | 0.0 /100 | #306 | Tragic 14.1% |
| Dutch West Indians | 0.0 /100 | #307 | Tragic 14.2% |
| Africans | 0.0 /100 | #308 | Tragic 14.2% |
| Somalis | 0.0 /100 | #309 | Tragic 14.3% |
| Seminole | 0.0 /100 | #310 | Tragic 14.3% |
| Hondurans | 0.0 /100 | #311 | Tragic 14.3% |
| Choctaw | 0.0 /100 | #312 | Tragic 14.4% |