Hawaiian vs Immigrants from Caribbean Single Father Poverty
COMPARE
Hawaiian
Immigrants from Caribbean
Single Father Poverty
Single Father Poverty Comparison
Hawaiians
Immigrants from Caribbean
15.1%
SINGLE FATHER POVERTY
99.9/ 100
METRIC RATING
58th/ 347
METRIC RANK
17.4%
SINGLE FATHER POVERTY
0.3/ 100
METRIC RATING
268th/ 347
METRIC RANK
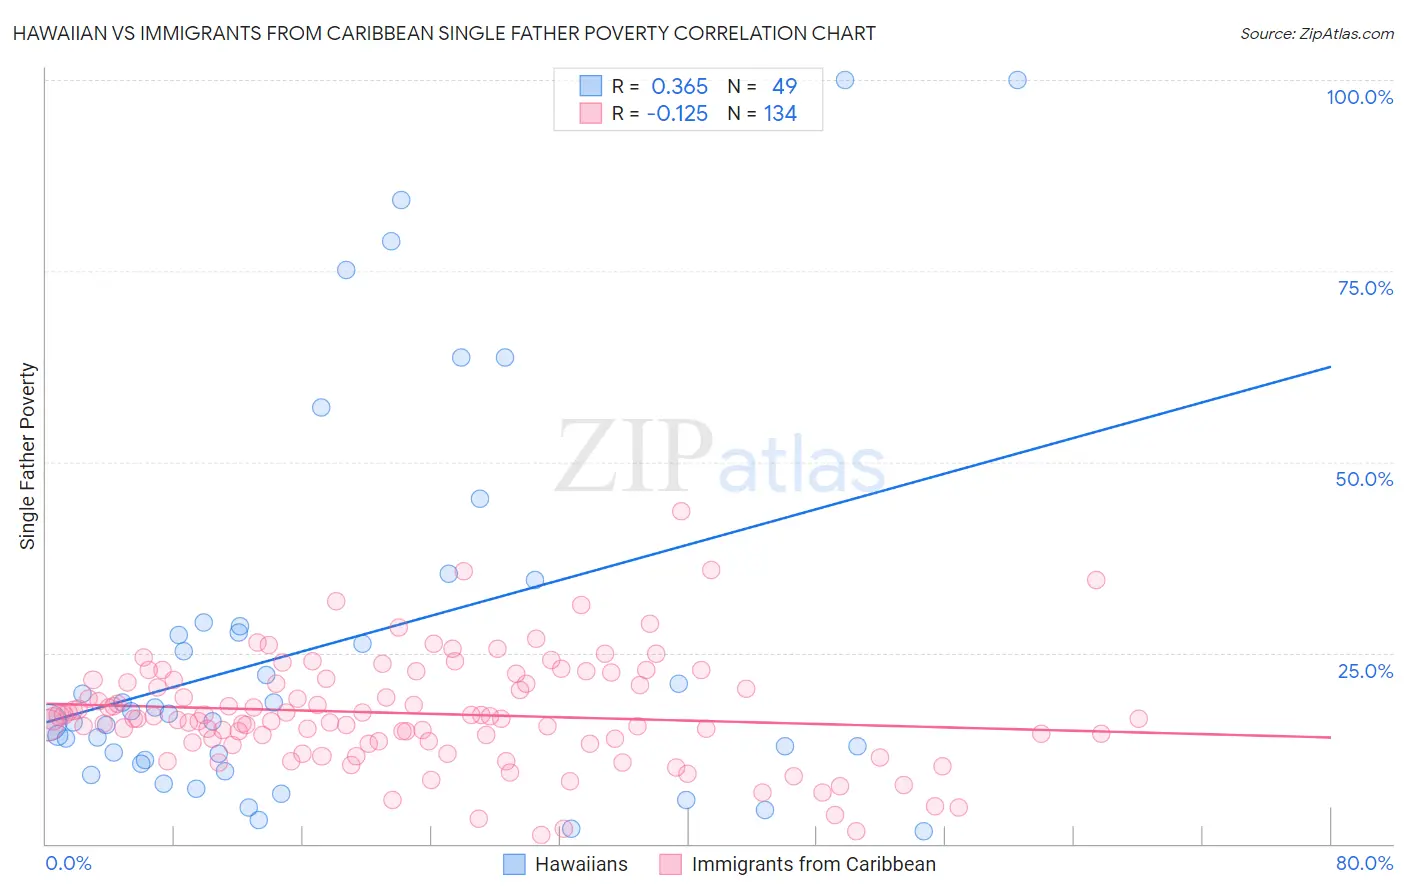
Hawaiian vs Immigrants from Caribbean Single Father Poverty Correlation Chart
The statistical analysis conducted on geographies consisting of 272,607,469 people shows a mild positive correlation between the proportion of Hawaiians and poverty level among single fathers in the United States with a correlation coefficient (R) of 0.365 and weighted average of 15.1%. Similarly, the statistical analysis conducted on geographies consisting of 347,686,703 people shows a poor negative correlation between the proportion of Immigrants from Caribbean and poverty level among single fathers in the United States with a correlation coefficient (R) of -0.125 and weighted average of 17.4%, a difference of 15.1%.
Single Father Poverty Correlation Summary
| Measurement | Hawaiian | Immigrants from Caribbean |
| Minimum | 1.7% | 1.2% |
| Maximum | 100.0% | 43.5% |
| Range | 98.3% | 42.3% |
| Mean | 26.3% | 17.0% |
| Median | 17.0% | 16.4% |
| Interquartile 25% (IQ1) | 10.7% | 13.3% |
| Interquartile 75% (IQ3) | 28.7% | 21.5% |
| Interquartile Range (IQR) | 18.0% | 8.2% |
| Standard Deviation (Sample) | 25.4% | 7.1% |
| Standard Deviation (Population) | 25.2% | 7.1% |
Similar Demographics by Single Father Poverty
Demographics Similar to Hawaiians by Single Father Poverty
In terms of single father poverty, the demographic groups most similar to Hawaiians are Laotian (15.1%, a difference of 0.060%), Guamanian/Chamorro (15.1%, a difference of 0.10%), Immigrants from Laos (15.1%, a difference of 0.14%), Immigrants from Bulgaria (15.0%, a difference of 0.42%), and Immigrants from Uzbekistan (15.0%, a difference of 0.47%).
| Demographics | Rating | Rank | Single Father Poverty |
| Immigrants | Pakistan | 99.9 /100 | #51 | Exceptional 15.0% |
| Immigrants | El Salvador | 99.9 /100 | #52 | Exceptional 15.0% |
| Immigrants | Kenya | 99.9 /100 | #53 | Exceptional 15.0% |
| Immigrants | Uzbekistan | 99.9 /100 | #54 | Exceptional 15.0% |
| Immigrants | Bulgaria | 99.9 /100 | #55 | Exceptional 15.0% |
| Immigrants | Laos | 99.9 /100 | #56 | Exceptional 15.1% |
| Laotians | 99.9 /100 | #57 | Exceptional 15.1% |
| Hawaiians | 99.9 /100 | #58 | Exceptional 15.1% |
| Guamanians/Chamorros | 99.9 /100 | #59 | Exceptional 15.1% |
| Puget Sound Salish | 99.8 /100 | #60 | Exceptional 15.2% |
| Immigrants | Bosnia and Herzegovina | 99.8 /100 | #61 | Exceptional 15.2% |
| Immigrants | Armenia | 99.8 /100 | #62 | Exceptional 15.2% |
| Immigrants | Sweden | 99.8 /100 | #63 | Exceptional 15.2% |
| Bangladeshis | 99.8 /100 | #64 | Exceptional 15.2% |
| Immigrants | Malaysia | 99.8 /100 | #65 | Exceptional 15.2% |
Demographics Similar to Immigrants from Caribbean by Single Father Poverty
In terms of single father poverty, the demographic groups most similar to Immigrants from Caribbean are Slavic (17.4%, a difference of 0.070%), Haitian (17.3%, a difference of 0.10%), Jamaican (17.3%, a difference of 0.14%), Polish (17.3%, a difference of 0.19%), and Slovene (17.3%, a difference of 0.20%).
| Demographics | Rating | Rank | Single Father Poverty |
| Swiss | 0.5 /100 | #261 | Tragic 17.3% |
| Immigrants | Zaire | 0.4 /100 | #262 | Tragic 17.3% |
| Lithuanians | 0.4 /100 | #263 | Tragic 17.3% |
| Slovenes | 0.3 /100 | #264 | Tragic 17.3% |
| Poles | 0.3 /100 | #265 | Tragic 17.3% |
| Jamaicans | 0.3 /100 | #266 | Tragic 17.3% |
| Haitians | 0.3 /100 | #267 | Tragic 17.3% |
| Immigrants | Caribbean | 0.3 /100 | #268 | Tragic 17.4% |
| Slavs | 0.3 /100 | #269 | Tragic 17.4% |
| Indonesians | 0.2 /100 | #270 | Tragic 17.4% |
| French American Indians | 0.2 /100 | #271 | Tragic 17.4% |
| Barbadians | 0.1 /100 | #272 | Tragic 17.5% |
| Italians | 0.1 /100 | #273 | Tragic 17.5% |
| Macedonians | 0.1 /100 | #274 | Tragic 17.7% |
| British West Indians | 0.0 /100 | #275 | Tragic 17.7% |