Hawaiian vs Nigerian Single Father Poverty
COMPARE
Hawaiian
Nigerian
Single Father Poverty
Single Father Poverty Comparison
Hawaiians
Nigerians
15.1%
SINGLE FATHER POVERTY
99.9/ 100
METRIC RATING
58th/ 347
METRIC RANK
16.1%
SINGLE FATHER POVERTY
76.8/ 100
METRIC RATING
148th/ 347
METRIC RANK
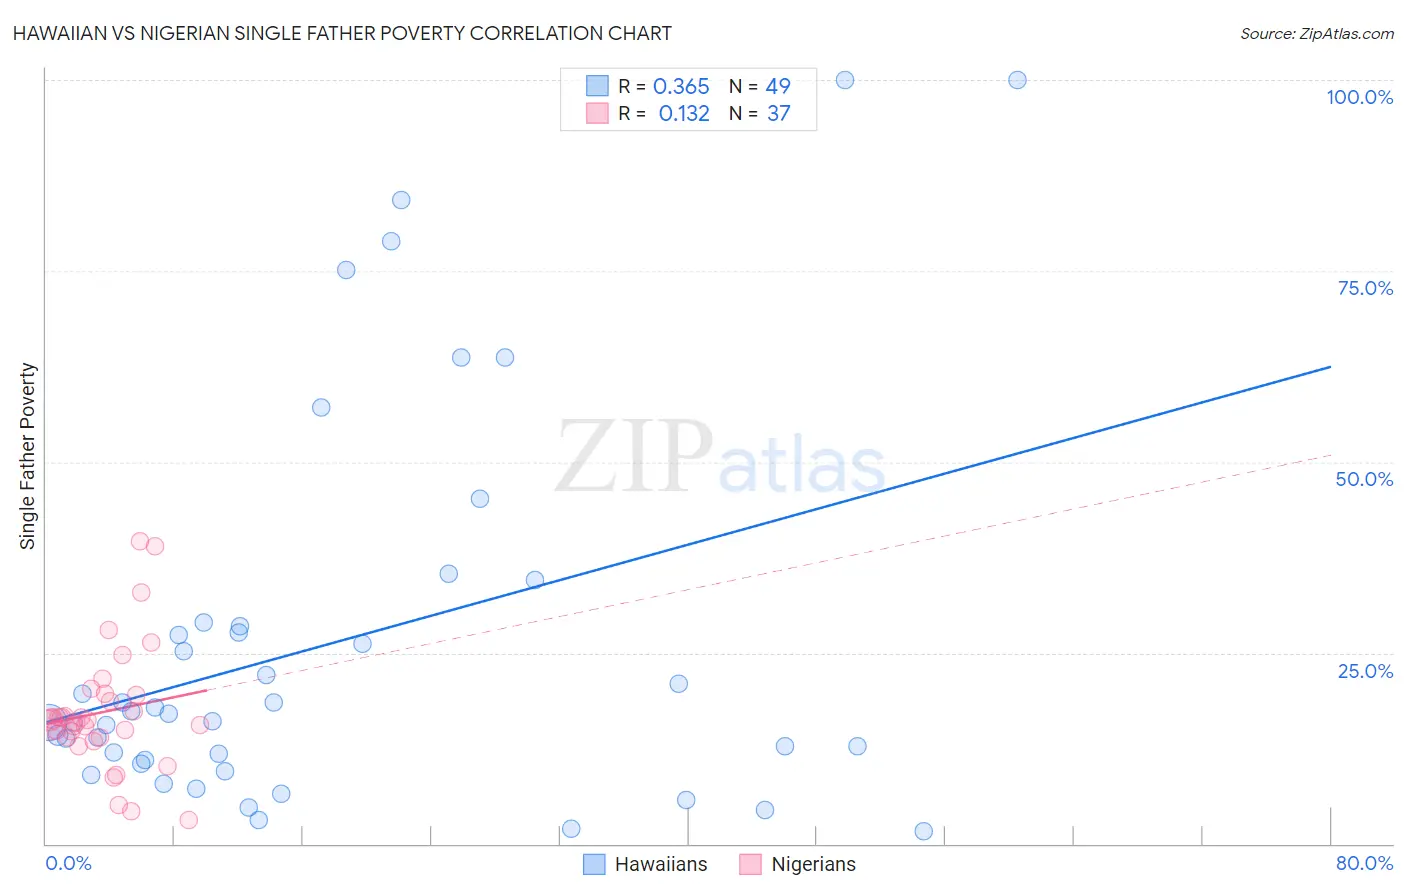
Hawaiian vs Nigerian Single Father Poverty Correlation Chart
The statistical analysis conducted on geographies consisting of 272,607,469 people shows a mild positive correlation between the proportion of Hawaiians and poverty level among single fathers in the United States with a correlation coefficient (R) of 0.365 and weighted average of 15.1%. Similarly, the statistical analysis conducted on geographies consisting of 274,896,002 people shows a poor positive correlation between the proportion of Nigerians and poverty level among single fathers in the United States with a correlation coefficient (R) of 0.132 and weighted average of 16.1%, a difference of 6.6%.
Single Father Poverty Correlation Summary
| Measurement | Hawaiian | Nigerian |
| Minimum | 1.7% | 3.1% |
| Maximum | 100.0% | 39.7% |
| Range | 98.3% | 36.6% |
| Mean | 26.3% | 17.3% |
| Median | 17.0% | 16.2% |
| Interquartile 25% (IQ1) | 10.7% | 13.9% |
| Interquartile 75% (IQ3) | 28.7% | 19.6% |
| Interquartile Range (IQR) | 18.0% | 5.7% |
| Standard Deviation (Sample) | 25.4% | 8.0% |
| Standard Deviation (Population) | 25.2% | 7.9% |
Similar Demographics by Single Father Poverty
Demographics Similar to Hawaiians by Single Father Poverty
In terms of single father poverty, the demographic groups most similar to Hawaiians are Laotian (15.1%, a difference of 0.060%), Guamanian/Chamorro (15.1%, a difference of 0.10%), Immigrants from Laos (15.1%, a difference of 0.14%), Immigrants from Bulgaria (15.0%, a difference of 0.42%), and Immigrants from Uzbekistan (15.0%, a difference of 0.47%).
| Demographics | Rating | Rank | Single Father Poverty |
| Immigrants | Pakistan | 99.9 /100 | #51 | Exceptional 15.0% |
| Immigrants | El Salvador | 99.9 /100 | #52 | Exceptional 15.0% |
| Immigrants | Kenya | 99.9 /100 | #53 | Exceptional 15.0% |
| Immigrants | Uzbekistan | 99.9 /100 | #54 | Exceptional 15.0% |
| Immigrants | Bulgaria | 99.9 /100 | #55 | Exceptional 15.0% |
| Immigrants | Laos | 99.9 /100 | #56 | Exceptional 15.1% |
| Laotians | 99.9 /100 | #57 | Exceptional 15.1% |
| Hawaiians | 99.9 /100 | #58 | Exceptional 15.1% |
| Guamanians/Chamorros | 99.9 /100 | #59 | Exceptional 15.1% |
| Puget Sound Salish | 99.8 /100 | #60 | Exceptional 15.2% |
| Immigrants | Bosnia and Herzegovina | 99.8 /100 | #61 | Exceptional 15.2% |
| Immigrants | Armenia | 99.8 /100 | #62 | Exceptional 15.2% |
| Immigrants | Sweden | 99.8 /100 | #63 | Exceptional 15.2% |
| Bangladeshis | 99.8 /100 | #64 | Exceptional 15.2% |
| Immigrants | Malaysia | 99.8 /100 | #65 | Exceptional 15.2% |
Demographics Similar to Nigerians by Single Father Poverty
In terms of single father poverty, the demographic groups most similar to Nigerians are Colombian (16.1%, a difference of 0.020%), Immigrants from Hungary (16.1%, a difference of 0.10%), South African (16.1%, a difference of 0.10%), Jordanian (16.1%, a difference of 0.16%), and Immigrants from France (16.1%, a difference of 0.22%).
| Demographics | Rating | Rank | Single Father Poverty |
| Liberians | 83.3 /100 | #141 | Excellent 16.0% |
| Immigrants | Mexico | 83.3 /100 | #142 | Excellent 16.0% |
| Immigrants | Central America | 83.1 /100 | #143 | Excellent 16.0% |
| Immigrants | Kuwait | 81.4 /100 | #144 | Excellent 16.0% |
| Immigrants | Western Asia | 80.7 /100 | #145 | Excellent 16.0% |
| Immigrants | Hungary | 78.3 /100 | #146 | Good 16.1% |
| Colombians | 77.1 /100 | #147 | Good 16.1% |
| Nigerians | 76.8 /100 | #148 | Good 16.1% |
| South Africans | 75.1 /100 | #149 | Good 16.1% |
| Jordanians | 74.2 /100 | #150 | Good 16.1% |
| Immigrants | France | 73.1 /100 | #151 | Good 16.1% |
| Immigrants | Zimbabwe | 72.1 /100 | #152 | Good 16.1% |
| Immigrants | Israel | 72.0 /100 | #153 | Good 16.1% |
| Mexicans | 70.1 /100 | #154 | Good 16.1% |
| Immigrants | Nicaragua | 67.8 /100 | #155 | Good 16.2% |