Hawaiian vs Immigrants from Latvia Child Poverty Under the Age of 16
COMPARE
Hawaiian
Immigrants from Latvia
Child Poverty Under the Age of 16
Child Poverty Under the Age of 16 Comparison
Hawaiians
Immigrants from Latvia
16.4%
CHILD POVERTY UNDER THE AGE OF 16
38.2/ 100
METRIC RATING
182nd/ 347
METRIC RANK
14.5%
CHILD POVERTY UNDER THE AGE OF 16
97.1/ 100
METRIC RATING
84th/ 347
METRIC RANK
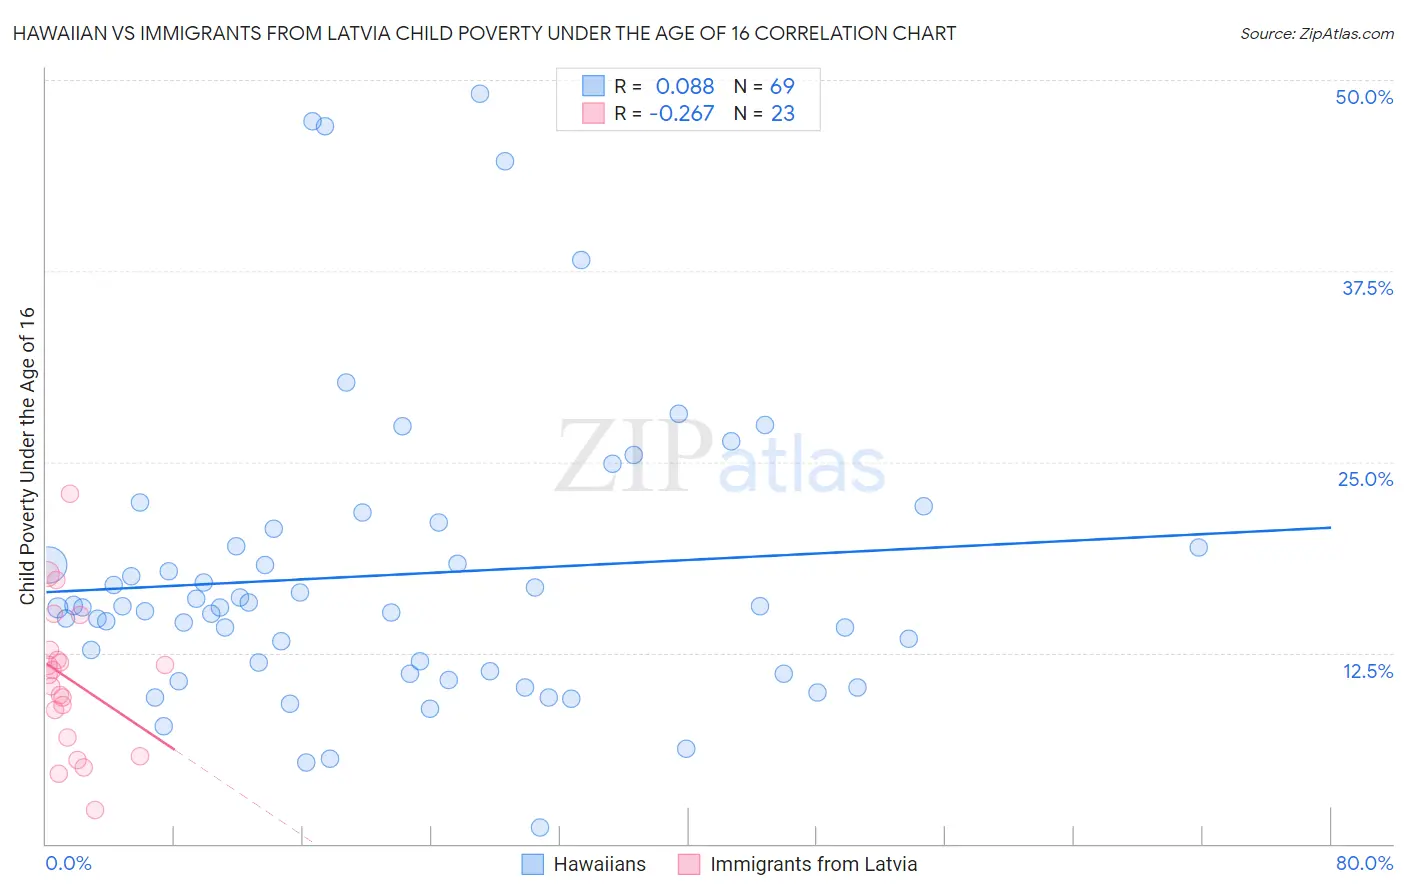
Hawaiian vs Immigrants from Latvia Child Poverty Under the Age of 16 Correlation Chart
The statistical analysis conducted on geographies consisting of 325,733,413 people shows a slight positive correlation between the proportion of Hawaiians and poverty level among children under the age of 16 in the United States with a correlation coefficient (R) of 0.088 and weighted average of 16.4%. Similarly, the statistical analysis conducted on geographies consisting of 113,191,371 people shows a weak negative correlation between the proportion of Immigrants from Latvia and poverty level among children under the age of 16 in the United States with a correlation coefficient (R) of -0.267 and weighted average of 14.5%, a difference of 13.4%.
Child Poverty Under the Age of 16 Correlation Summary
| Measurement | Hawaiian | Immigrants from Latvia |
| Minimum | 1.1% | 2.2% |
| Maximum | 49.1% | 22.9% |
| Range | 48.0% | 20.7% |
| Mean | 17.6% | 10.8% |
| Median | 15.5% | 11.1% |
| Interquartile 25% (IQ1) | 11.2% | 7.0% |
| Interquartile 75% (IQ3) | 20.1% | 12.7% |
| Interquartile Range (IQR) | 8.8% | 5.7% |
| Standard Deviation (Sample) | 9.7% | 4.8% |
| Standard Deviation (Population) | 9.6% | 4.7% |
Similar Demographics by Child Poverty Under the Age of 16
Demographics Similar to Hawaiians by Child Poverty Under the Age of 16
In terms of child poverty under the age of 16, the demographic groups most similar to Hawaiians are Celtic (16.4%, a difference of 0.010%), Immigrants from Western Asia (16.4%, a difference of 0.030%), Immigrants from Bosnia and Herzegovina (16.5%, a difference of 0.11%), Immigrants from South America (16.4%, a difference of 0.32%), and South American Indian (16.4%, a difference of 0.45%).
| Demographics | Rating | Rank | Child Poverty Under the Age of 16 |
| Scotch-Irish | 47.1 /100 | #175 | Average 16.3% |
| Lebanese | 45.9 /100 | #176 | Average 16.3% |
| Ethiopians | 43.4 /100 | #177 | Average 16.3% |
| Immigrants | Ethiopia | 42.3 /100 | #178 | Average 16.4% |
| Immigrants | Syria | 42.3 /100 | #179 | Average 16.4% |
| South American Indians | 41.8 /100 | #180 | Average 16.4% |
| Immigrants | South America | 40.8 /100 | #181 | Average 16.4% |
| Hawaiians | 38.2 /100 | #182 | Fair 16.4% |
| Celtics | 38.2 /100 | #183 | Fair 16.4% |
| Immigrants | Western Asia | 38.0 /100 | #184 | Fair 16.4% |
| Immigrants | Bosnia and Herzegovina | 37.4 /100 | #185 | Fair 16.5% |
| Kenyans | 34.1 /100 | #186 | Fair 16.5% |
| Arabs | 31.4 /100 | #187 | Fair 16.6% |
| Immigrants | Morocco | 31.2 /100 | #188 | Fair 16.6% |
| Immigrants | Portugal | 30.0 /100 | #189 | Fair 16.6% |
Demographics Similar to Immigrants from Latvia by Child Poverty Under the Age of 16
In terms of child poverty under the age of 16, the demographic groups most similar to Immigrants from Latvia are Egyptian (14.5%, a difference of 0.020%), Soviet Union (14.5%, a difference of 0.020%), Immigrants from Canada (14.5%, a difference of 0.050%), Finnish (14.5%, a difference of 0.080%), and Immigrants from Argentina (14.5%, a difference of 0.10%).
| Demographics | Rating | Rank | Child Poverty Under the Age of 16 |
| Australians | 97.5 /100 | #77 | Exceptional 14.4% |
| Immigrants | Russia | 97.3 /100 | #78 | Exceptional 14.5% |
| Swiss | 97.3 /100 | #79 | Exceptional 14.5% |
| Immigrants | North Macedonia | 97.2 /100 | #80 | Exceptional 14.5% |
| Finns | 97.2 /100 | #81 | Exceptional 14.5% |
| Immigrants | Canada | 97.2 /100 | #82 | Exceptional 14.5% |
| Egyptians | 97.2 /100 | #83 | Exceptional 14.5% |
| Immigrants | Latvia | 97.1 /100 | #84 | Exceptional 14.5% |
| Soviet Union | 97.1 /100 | #85 | Exceptional 14.5% |
| Immigrants | Argentina | 97.1 /100 | #86 | Exceptional 14.5% |
| Taiwanese | 97.1 /100 | #87 | Exceptional 14.5% |
| Northern Europeans | 97.0 /100 | #88 | Exceptional 14.5% |
| Germans | 96.9 /100 | #89 | Exceptional 14.5% |
| Austrians | 96.9 /100 | #90 | Exceptional 14.5% |
| Immigrants | North America | 96.7 /100 | #91 | Exceptional 14.6% |