Hawaiian vs Immigrants from Sri Lanka Single Mother Poverty
COMPARE
Hawaiian
Immigrants from Sri Lanka
Single Mother Poverty
Single Mother Poverty Comparison
Hawaiians
Immigrants from Sri Lanka
29.2%
SINGLE MOTHER POVERTY
47.8/ 100
METRIC RATING
176th/ 347
METRIC RANK
26.3%
SINGLE MOTHER POVERTY
100.0/ 100
METRIC RATING
26th/ 347
METRIC RANK
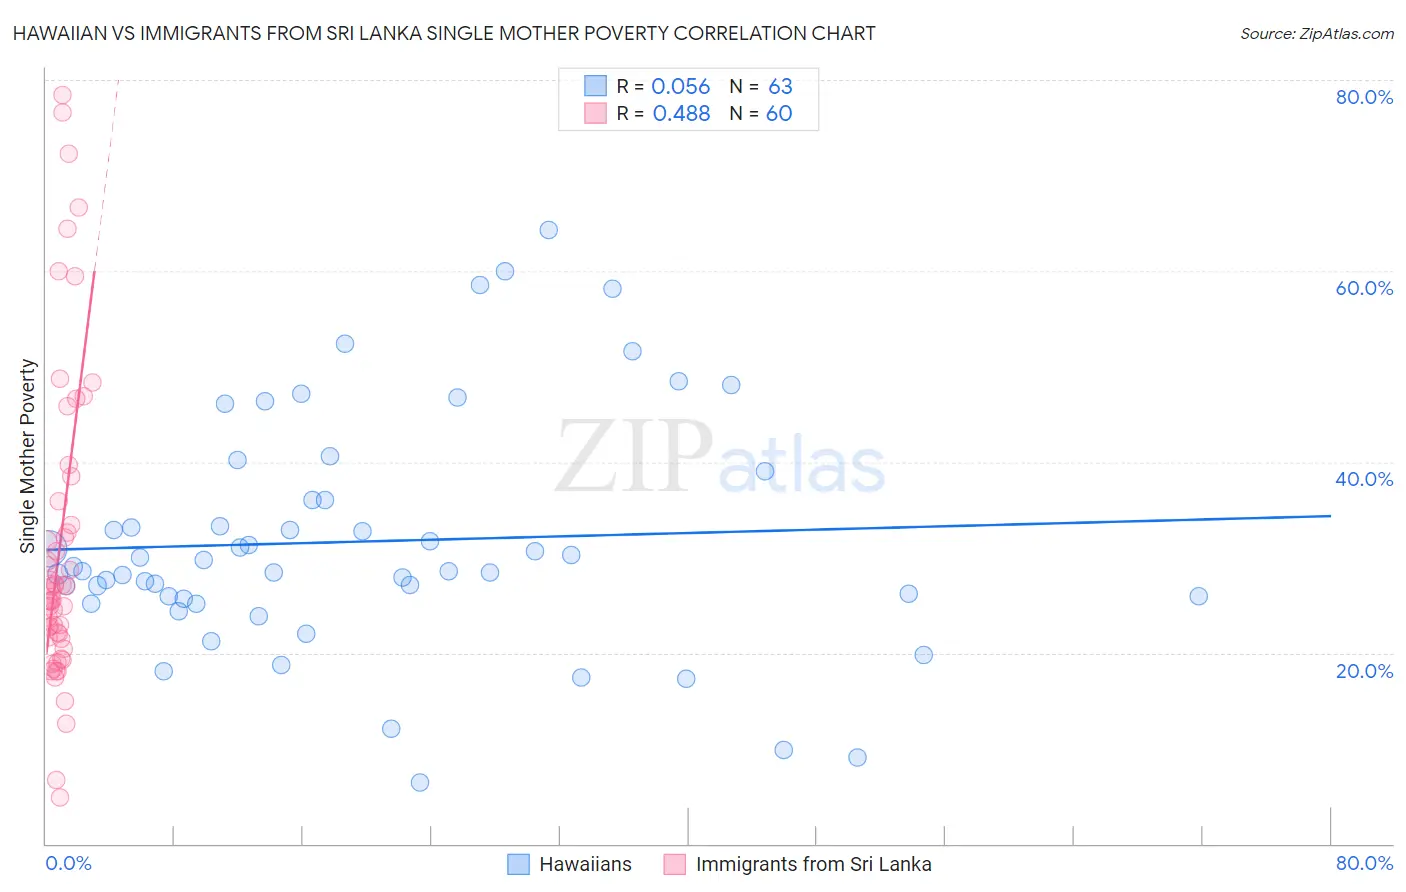
Hawaiian vs Immigrants from Sri Lanka Single Mother Poverty Correlation Chart
The statistical analysis conducted on geographies consisting of 322,664,662 people shows a slight positive correlation between the proportion of Hawaiians and poverty level among single mothers in the United States with a correlation coefficient (R) of 0.056 and weighted average of 29.2%. Similarly, the statistical analysis conducted on geographies consisting of 147,892,421 people shows a moderate positive correlation between the proportion of Immigrants from Sri Lanka and poverty level among single mothers in the United States with a correlation coefficient (R) of 0.488 and weighted average of 26.3%, a difference of 10.9%.
Single Mother Poverty Correlation Summary
| Measurement | Hawaiian | Immigrants from Sri Lanka |
| Minimum | 6.4% | 4.9% |
| Maximum | 64.3% | 78.5% |
| Range | 57.9% | 73.6% |
| Mean | 31.7% | 31.2% |
| Median | 28.6% | 26.0% |
| Interquartile 25% (IQ1) | 25.7% | 21.6% |
| Interquartile 75% (IQ3) | 36.0% | 34.6% |
| Interquartile Range (IQR) | 10.3% | 13.0% |
| Standard Deviation (Sample) | 12.4% | 16.5% |
| Standard Deviation (Population) | 12.3% | 16.3% |
Similar Demographics by Single Mother Poverty
Demographics Similar to Hawaiians by Single Mother Poverty
In terms of single mother poverty, the demographic groups most similar to Hawaiians are Immigrants from Costa Rica (29.2%, a difference of 0.040%), Immigrants from Saudi Arabia (29.2%, a difference of 0.10%), British (29.2%, a difference of 0.13%), Immigrants from Bosnia and Herzegovina (29.2%, a difference of 0.13%), and South American Indian (29.3%, a difference of 0.22%).
| Demographics | Rating | Rank | Single Mother Poverty |
| Immigrants | Uruguay | 57.2 /100 | #169 | Average 29.1% |
| New Zealanders | 55.1 /100 | #170 | Average 29.1% |
| Puget Sound Salish | 55.1 /100 | #171 | Average 29.1% |
| Carpatho Rusyns | 53.8 /100 | #172 | Average 29.1% |
| British | 50.6 /100 | #173 | Average 29.2% |
| Immigrants | Saudi Arabia | 50.0 /100 | #174 | Average 29.2% |
| Immigrants | Costa Rica | 48.8 /100 | #175 | Average 29.2% |
| Hawaiians | 47.8 /100 | #176 | Average 29.2% |
| Immigrants | Bosnia and Herzegovina | 45.1 /100 | #177 | Average 29.2% |
| South American Indians | 43.2 /100 | #178 | Average 29.3% |
| Immigrants | Uzbekistan | 42.6 /100 | #179 | Average 29.3% |
| Immigrants | Norway | 41.5 /100 | #180 | Average 29.3% |
| Canadians | 40.4 /100 | #181 | Average 29.3% |
| Immigrants | Eastern Africa | 38.5 /100 | #182 | Fair 29.3% |
| Nepalese | 38.3 /100 | #183 | Fair 29.3% |
Demographics Similar to Immigrants from Sri Lanka by Single Mother Poverty
In terms of single mother poverty, the demographic groups most similar to Immigrants from Sri Lanka are Immigrants from Asia (26.3%, a difference of 0.13%), Immigrants from Japan (26.4%, a difference of 0.22%), Korean (26.4%, a difference of 0.24%), Jordanian (26.4%, a difference of 0.29%), and Immigrants from Moldova (26.2%, a difference of 0.32%).
| Demographics | Rating | Rank | Single Mother Poverty |
| Immigrants | Eastern Asia | 100.0 /100 | #19 | Exceptional 26.1% |
| Immigrants | China | 100.0 /100 | #20 | Exceptional 26.1% |
| Immigrants | Bolivia | 100.0 /100 | #21 | Exceptional 26.2% |
| Immigrants | Korea | 100.0 /100 | #22 | Exceptional 26.2% |
| Burmese | 100.0 /100 | #23 | Exceptional 26.2% |
| Immigrants | Moldova | 100.0 /100 | #24 | Exceptional 26.2% |
| Immigrants | Asia | 100.0 /100 | #25 | Exceptional 26.3% |
| Immigrants | Sri Lanka | 100.0 /100 | #26 | Exceptional 26.3% |
| Immigrants | Japan | 100.0 /100 | #27 | Exceptional 26.4% |
| Koreans | 100.0 /100 | #28 | Exceptional 26.4% |
| Jordanians | 100.0 /100 | #29 | Exceptional 26.4% |
| Turks | 100.0 /100 | #30 | Exceptional 26.4% |
| Immigrants | Philippines | 100.0 /100 | #31 | Exceptional 26.5% |
| Tongans | 99.9 /100 | #32 | Exceptional 26.5% |
| Bulgarians | 99.9 /100 | #33 | Exceptional 26.5% |