Haitian vs Shoshone Unemployment Among Ages 35 to 44 years
COMPARE
Haitian
Shoshone
Unemployment Among Ages 35 to 44 years
Unemployment Among Ages 35 to 44 years Comparison
Haitians
Shoshone
5.5%
UNEMPLOYMENT AMONG AGES 35 TO 44 YEARS
0.0/ 100
METRIC RATING
284th/ 347
METRIC RANK
6.6%
UNEMPLOYMENT AMONG AGES 35 TO 44 YEARS
0.0/ 100
METRIC RATING
328th/ 347
METRIC RANK
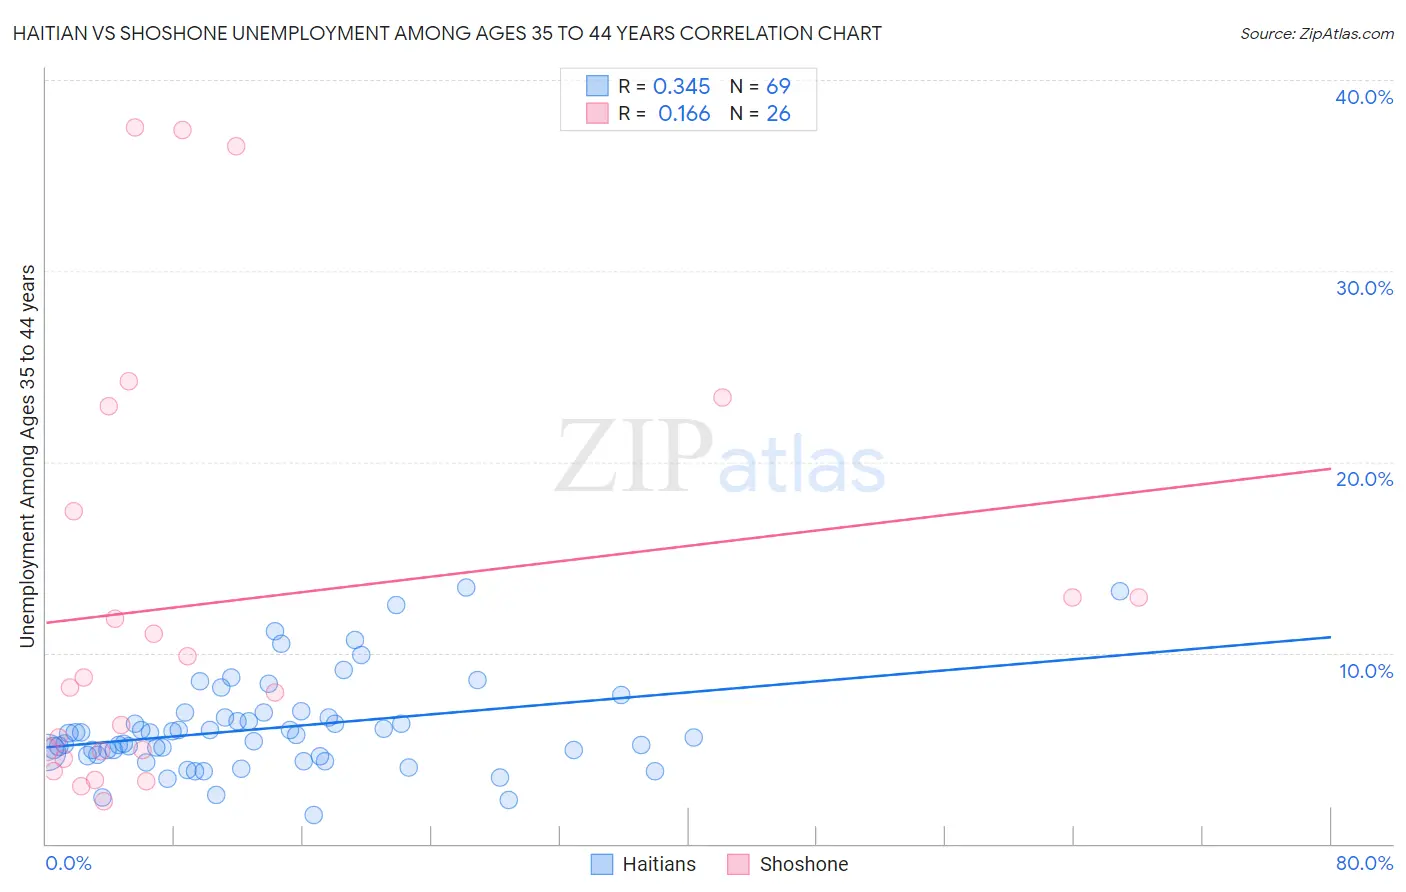
Haitian vs Shoshone Unemployment Among Ages 35 to 44 years Correlation Chart
The statistical analysis conducted on geographies consisting of 283,461,546 people shows a mild positive correlation between the proportion of Haitians and unemployment rate among population between the ages 35 and 44 in the United States with a correlation coefficient (R) of 0.345 and weighted average of 5.5%. Similarly, the statistical analysis conducted on geographies consisting of 66,150,658 people shows a poor positive correlation between the proportion of Shoshone and unemployment rate among population between the ages 35 and 44 in the United States with a correlation coefficient (R) of 0.166 and weighted average of 6.6%, a difference of 20.6%.
Unemployment Among Ages 35 to 44 years Correlation Summary
| Measurement | Haitian | Shoshone |
| Minimum | 1.5% | 2.2% |
| Maximum | 13.4% | 37.5% |
| Range | 11.9% | 35.3% |
| Mean | 6.1% | 12.7% |
| Median | 5.7% | 8.5% |
| Interquartile 25% (IQ1) | 4.6% | 4.9% |
| Interquartile 75% (IQ3) | 6.8% | 17.4% |
| Interquartile Range (IQR) | 2.1% | 12.5% |
| Standard Deviation (Sample) | 2.4% | 11.0% |
| Standard Deviation (Population) | 2.4% | 10.8% |
Similar Demographics by Unemployment Among Ages 35 to 44 years
Demographics Similar to Haitians by Unemployment Among Ages 35 to 44 years
In terms of unemployment among ages 35 to 44 years, the demographic groups most similar to Haitians are Hispanic or Latino (5.5%, a difference of 0.16%), Immigrants from Micronesia (5.5%, a difference of 0.28%), French American Indian (5.5%, a difference of 0.40%), Immigrants from Ecuador (5.4%, a difference of 0.54%), and Cree (5.5%, a difference of 0.56%).
| Demographics | Rating | Rank | Unemployment Among Ages 35 to 44 years |
| Immigrants | Caribbean | 0.0 /100 | #277 | Tragic 5.4% |
| Lumbee | 0.0 /100 | #278 | Tragic 5.4% |
| Immigrants | Senegal | 0.0 /100 | #279 | Tragic 5.4% |
| Ecuadorians | 0.0 /100 | #280 | Tragic 5.4% |
| Immigrants | Portugal | 0.0 /100 | #281 | Tragic 5.4% |
| Immigrants | Ghana | 0.0 /100 | #282 | Tragic 5.4% |
| Immigrants | Ecuador | 0.0 /100 | #283 | Tragic 5.4% |
| Haitians | 0.0 /100 | #284 | Tragic 5.5% |
| Hispanics or Latinos | 0.0 /100 | #285 | Tragic 5.5% |
| Immigrants | Micronesia | 0.0 /100 | #286 | Tragic 5.5% |
| French American Indians | 0.0 /100 | #287 | Tragic 5.5% |
| Cree | 0.0 /100 | #288 | Tragic 5.5% |
| Spanish American Indians | 0.0 /100 | #289 | Tragic 5.5% |
| Jamaicans | 0.0 /100 | #290 | Tragic 5.5% |
| Dutch West Indians | 0.0 /100 | #291 | Tragic 5.5% |
Demographics Similar to Shoshone by Unemployment Among Ages 35 to 44 years
In terms of unemployment among ages 35 to 44 years, the demographic groups most similar to Shoshone are Cape Verdean (6.6%, a difference of 0.69%), Alaska Native (6.6%, a difference of 0.74%), Immigrants from Yemen (6.6%, a difference of 0.81%), Menominee (6.5%, a difference of 1.2%), and Dominican (6.4%, a difference of 2.8%).
| Demographics | Rating | Rank | Unemployment Among Ages 35 to 44 years |
| Chippewa | 0.0 /100 | #321 | Tragic 6.2% |
| Immigrants | Dominican Republic | 0.0 /100 | #322 | Tragic 6.4% |
| Dominicans | 0.0 /100 | #323 | Tragic 6.4% |
| Menominee | 0.0 /100 | #324 | Tragic 6.5% |
| Immigrants | Yemen | 0.0 /100 | #325 | Tragic 6.6% |
| Alaska Natives | 0.0 /100 | #326 | Tragic 6.6% |
| Cape Verdeans | 0.0 /100 | #327 | Tragic 6.6% |
| Shoshone | 0.0 /100 | #328 | Tragic 6.6% |
| Paiute | 0.0 /100 | #329 | Tragic 6.9% |
| Immigrants | Cabo Verde | 0.0 /100 | #330 | Tragic 6.9% |
| Pueblo | 0.0 /100 | #331 | Tragic 7.1% |
| Natives/Alaskans | 0.0 /100 | #332 | Tragic 7.3% |
| Puerto Ricans | 0.0 /100 | #333 | Tragic 7.6% |
| Houma | 0.0 /100 | #334 | Tragic 7.8% |
| Sioux | 0.0 /100 | #335 | Tragic 8.4% |