Haitian vs Iraqi Male Poverty
COMPARE
Haitian
Iraqi
Male Poverty
Male Poverty Comparison
Haitians
Iraqis
13.7%
MALE POVERTY
0.0/ 100
METRIC RATING
279th/ 347
METRIC RANK
11.7%
MALE POVERTY
14.7/ 100
METRIC RATING
198th/ 347
METRIC RANK
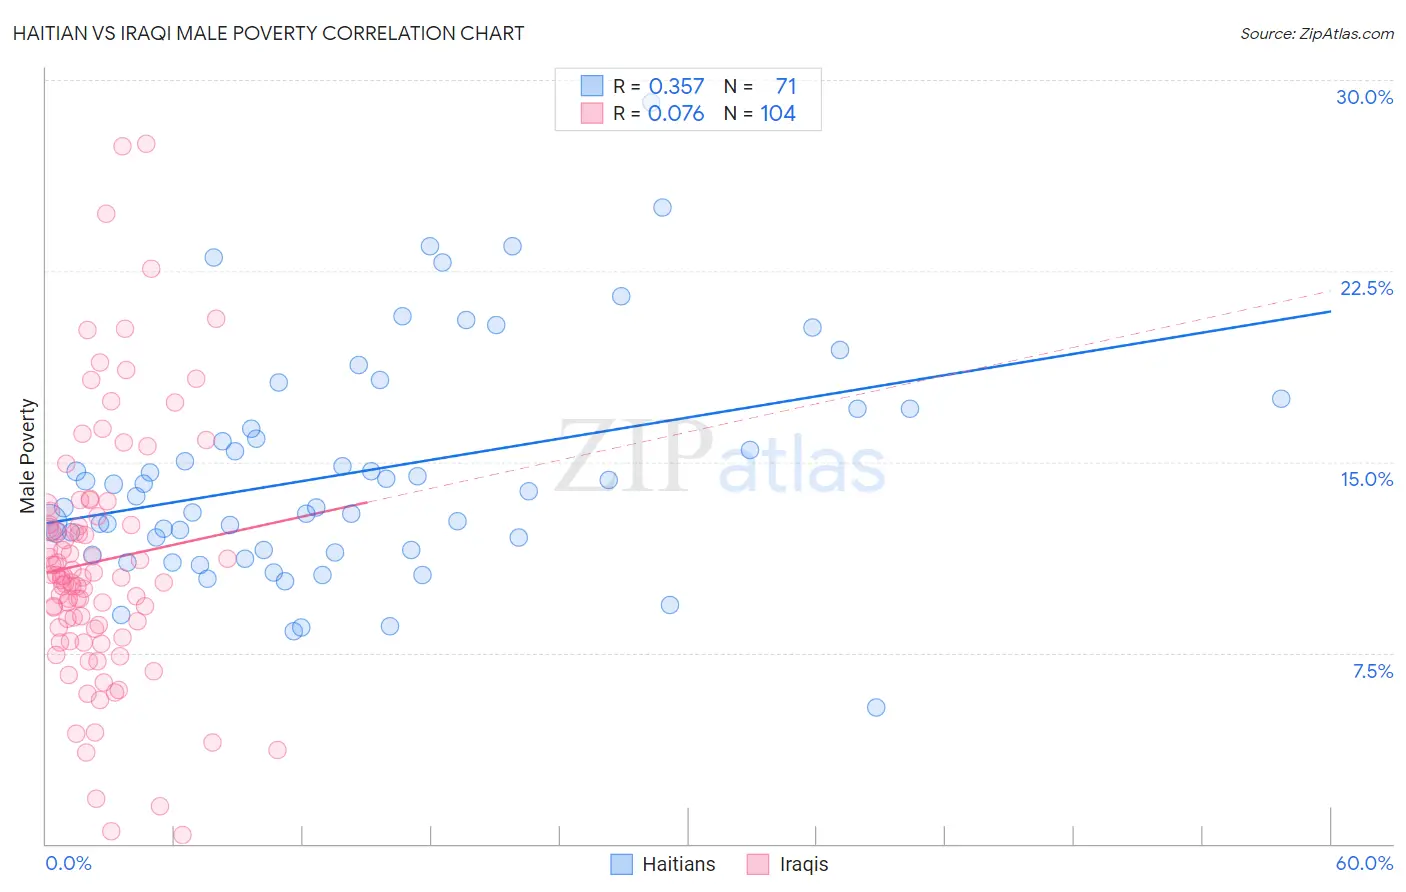
Haitian vs Iraqi Male Poverty Correlation Chart
The statistical analysis conducted on geographies consisting of 287,676,273 people shows a mild positive correlation between the proportion of Haitians and poverty level among males in the United States with a correlation coefficient (R) of 0.357 and weighted average of 13.7%. Similarly, the statistical analysis conducted on geographies consisting of 170,573,480 people shows a slight positive correlation between the proportion of Iraqis and poverty level among males in the United States with a correlation coefficient (R) of 0.076 and weighted average of 11.7%, a difference of 17.1%.
Male Poverty Correlation Summary
| Measurement | Haitian | Iraqi |
| Minimum | 5.4% | 0.32% |
| Maximum | 29.1% | 27.5% |
| Range | 23.8% | 27.2% |
| Mean | 14.6% | 11.1% |
| Median | 13.7% | 10.5% |
| Interquartile 25% (IQ1) | 11.5% | 8.5% |
| Interquartile 75% (IQ3) | 17.1% | 12.7% |
| Interquartile Range (IQR) | 5.5% | 4.2% |
| Standard Deviation (Sample) | 4.5% | 5.0% |
| Standard Deviation (Population) | 4.4% | 5.0% |
Similar Demographics by Male Poverty
Demographics Similar to Haitians by Male Poverty
In terms of male poverty, the demographic groups most similar to Haitians are Mexican (13.7%, a difference of 0.090%), Yaqui (13.7%, a difference of 0.14%), Belizean (13.6%, a difference of 0.18%), Bangladeshi (13.6%, a difference of 0.27%), and Immigrants from Cabo Verde (13.7%, a difference of 0.41%).
| Demographics | Rating | Rank | Male Poverty |
| Immigrants | Bahamas | 0.0 /100 | #272 | Tragic 13.5% |
| Chickasaw | 0.0 /100 | #273 | Tragic 13.5% |
| Immigrants | West Indies | 0.0 /100 | #274 | Tragic 13.5% |
| Barbadians | 0.0 /100 | #275 | Tragic 13.6% |
| Immigrants | Latin America | 0.0 /100 | #276 | Tragic 13.6% |
| Bangladeshis | 0.0 /100 | #277 | Tragic 13.6% |
| Belizeans | 0.0 /100 | #278 | Tragic 13.6% |
| Haitians | 0.0 /100 | #279 | Tragic 13.7% |
| Mexicans | 0.0 /100 | #280 | Tragic 13.7% |
| Yaqui | 0.0 /100 | #281 | Tragic 13.7% |
| Immigrants | Cabo Verde | 0.0 /100 | #282 | Tragic 13.7% |
| Comanche | 0.0 /100 | #283 | Tragic 13.8% |
| Immigrants | Haiti | 0.0 /100 | #284 | Tragic 13.8% |
| West Indians | 0.0 /100 | #285 | Tragic 13.8% |
| Shoshone | 0.0 /100 | #286 | Tragic 13.8% |
Demographics Similar to Iraqis by Male Poverty
In terms of male poverty, the demographic groups most similar to Iraqis are Spanish (11.7%, a difference of 0.11%), Delaware (11.7%, a difference of 0.14%), Hmong (11.6%, a difference of 0.20%), Arab (11.6%, a difference of 0.21%), and Immigrants from Lebanon (11.7%, a difference of 0.21%).
| Demographics | Rating | Rank | Male Poverty |
| South American Indians | 22.8 /100 | #191 | Fair 11.5% |
| Immigrants | Uruguay | 19.1 /100 | #192 | Poor 11.6% |
| Immigrants | Kuwait | 17.3 /100 | #193 | Poor 11.6% |
| Immigrants | Kenya | 16.1 /100 | #194 | Poor 11.6% |
| Arabs | 15.8 /100 | #195 | Poor 11.6% |
| Hmong | 15.8 /100 | #196 | Poor 11.6% |
| Delaware | 15.4 /100 | #197 | Poor 11.7% |
| Iraqis | 14.7 /100 | #198 | Poor 11.7% |
| Spanish | 14.1 /100 | #199 | Poor 11.7% |
| Immigrants | Lebanon | 13.6 /100 | #200 | Poor 11.7% |
| Spaniards | 13.5 /100 | #201 | Poor 11.7% |
| Aleuts | 10.4 /100 | #202 | Poor 11.8% |
| Immigrants | Western Asia | 9.8 /100 | #203 | Tragic 11.8% |
| Immigrants | Uganda | 8.5 /100 | #204 | Tragic 11.8% |
| Panamanians | 6.2 /100 | #205 | Tragic 11.9% |