Haitian vs Asian Male Poverty
COMPARE
Haitian
Asian
Male Poverty
Male Poverty Comparison
Haitians
Asians
13.7%
MALE POVERTY
0.0/ 100
METRIC RATING
279th/ 347
METRIC RANK
10.0%
MALE POVERTY
98.7/ 100
METRIC RATING
52nd/ 347
METRIC RANK
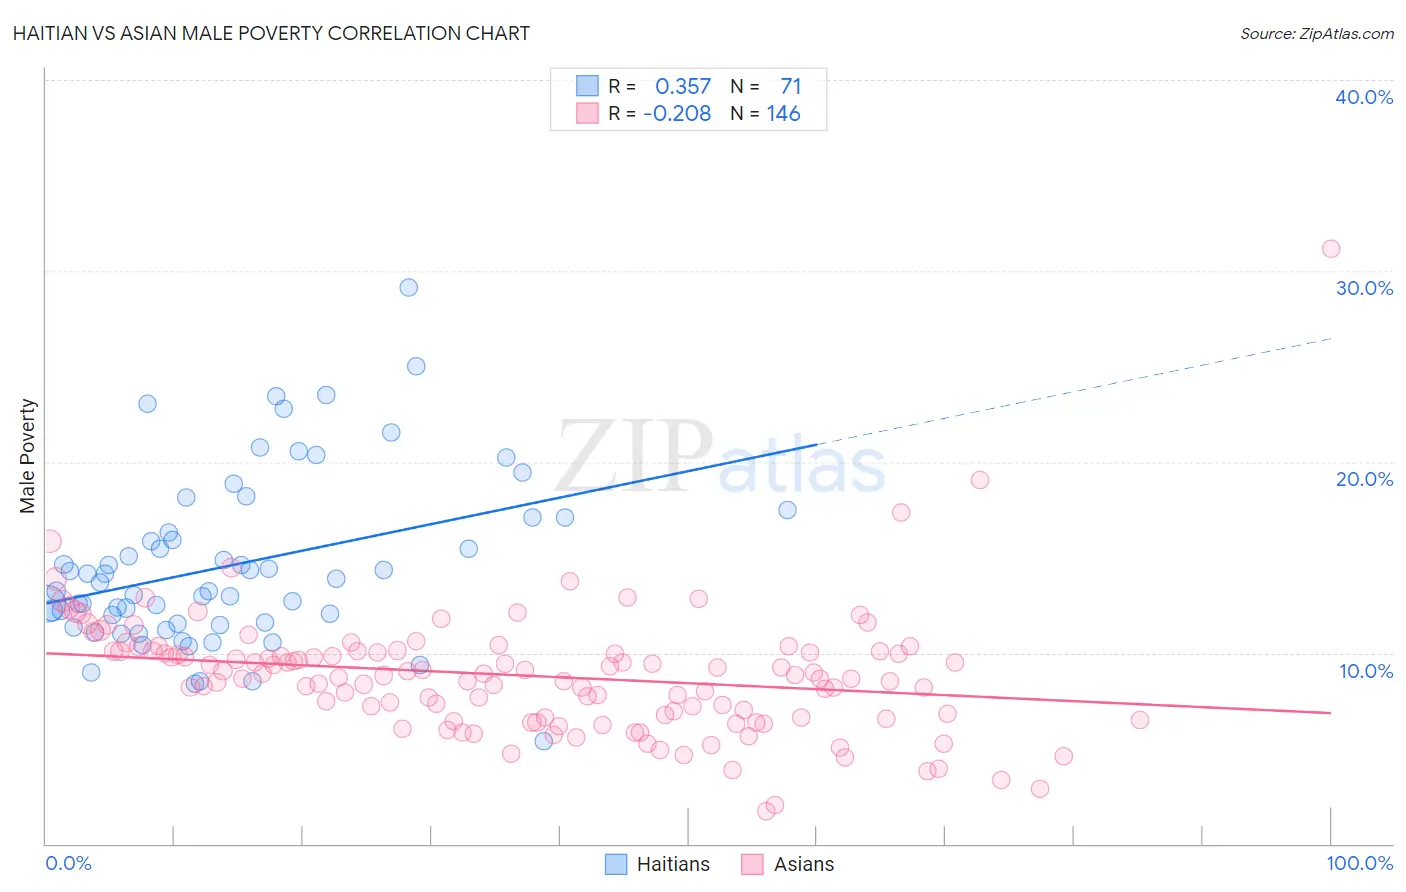
Haitian vs Asian Male Poverty Correlation Chart
The statistical analysis conducted on geographies consisting of 287,676,273 people shows a mild positive correlation between the proportion of Haitians and poverty level among males in the United States with a correlation coefficient (R) of 0.357 and weighted average of 13.7%. Similarly, the statistical analysis conducted on geographies consisting of 549,643,011 people shows a weak negative correlation between the proportion of Asians and poverty level among males in the United States with a correlation coefficient (R) of -0.208 and weighted average of 10.0%, a difference of 36.5%.
Male Poverty Correlation Summary
| Measurement | Haitian | Asian |
| Minimum | 5.4% | 1.7% |
| Maximum | 29.1% | 31.2% |
| Range | 23.8% | 29.4% |
| Mean | 14.6% | 8.8% |
| Median | 13.7% | 8.8% |
| Interquartile 25% (IQ1) | 11.5% | 6.6% |
| Interquartile 75% (IQ3) | 17.1% | 10.1% |
| Interquartile Range (IQR) | 5.5% | 3.5% |
| Standard Deviation (Sample) | 4.5% | 3.3% |
| Standard Deviation (Population) | 4.4% | 3.3% |
Similar Demographics by Male Poverty
Demographics Similar to Haitians by Male Poverty
In terms of male poverty, the demographic groups most similar to Haitians are Mexican (13.7%, a difference of 0.090%), Yaqui (13.7%, a difference of 0.14%), Belizean (13.6%, a difference of 0.18%), Bangladeshi (13.6%, a difference of 0.27%), and Immigrants from Cabo Verde (13.7%, a difference of 0.41%).
| Demographics | Rating | Rank | Male Poverty |
| Immigrants | Bahamas | 0.0 /100 | #272 | Tragic 13.5% |
| Chickasaw | 0.0 /100 | #273 | Tragic 13.5% |
| Immigrants | West Indies | 0.0 /100 | #274 | Tragic 13.5% |
| Barbadians | 0.0 /100 | #275 | Tragic 13.6% |
| Immigrants | Latin America | 0.0 /100 | #276 | Tragic 13.6% |
| Bangladeshis | 0.0 /100 | #277 | Tragic 13.6% |
| Belizeans | 0.0 /100 | #278 | Tragic 13.6% |
| Haitians | 0.0 /100 | #279 | Tragic 13.7% |
| Mexicans | 0.0 /100 | #280 | Tragic 13.7% |
| Yaqui | 0.0 /100 | #281 | Tragic 13.7% |
| Immigrants | Cabo Verde | 0.0 /100 | #282 | Tragic 13.7% |
| Comanche | 0.0 /100 | #283 | Tragic 13.8% |
| Immigrants | Haiti | 0.0 /100 | #284 | Tragic 13.8% |
| West Indians | 0.0 /100 | #285 | Tragic 13.8% |
| Shoshone | 0.0 /100 | #286 | Tragic 13.8% |
Demographics Similar to Asians by Male Poverty
In terms of male poverty, the demographic groups most similar to Asians are Immigrants from Czechoslovakia (10.0%, a difference of 0.070%), Immigrants from Croatia (10.0%, a difference of 0.090%), Immigrants from Philippines (10.0%, a difference of 0.19%), Slovene (10.0%, a difference of 0.24%), and Immigrants from Singapore (10.0%, a difference of 0.34%).
| Demographics | Rating | Rank | Male Poverty |
| Immigrants | Serbia | 98.9 /100 | #45 | Exceptional 10.0% |
| Turks | 98.9 /100 | #46 | Exceptional 10.0% |
| Immigrants | Singapore | 98.8 /100 | #47 | Exceptional 10.0% |
| Immigrants | Japan | 98.8 /100 | #48 | Exceptional 10.0% |
| Slovenes | 98.8 /100 | #49 | Exceptional 10.0% |
| Immigrants | Philippines | 98.7 /100 | #50 | Exceptional 10.0% |
| Immigrants | Croatia | 98.7 /100 | #51 | Exceptional 10.0% |
| Asians | 98.7 /100 | #52 | Exceptional 10.0% |
| Immigrants | Czechoslovakia | 98.6 /100 | #53 | Exceptional 10.0% |
| Immigrants | Austria | 98.5 /100 | #54 | Exceptional 10.0% |
| Germans | 98.3 /100 | #55 | Exceptional 10.1% |
| Immigrants | Bulgaria | 98.2 /100 | #56 | Exceptional 10.1% |
| Estonians | 98.1 /100 | #57 | Exceptional 10.1% |
| Scandinavians | 98.0 /100 | #58 | Exceptional 10.1% |
| Immigrants | Europe | 97.9 /100 | #59 | Exceptional 10.1% |