Haitian vs Immigrants from Ghana No Vehicles in Household
COMPARE
Haitian
Immigrants from Ghana
No Vehicles in Household
No Vehicles in Household Comparison
Haitians
Immigrants from Ghana
14.9%
NO VEHICLES IN HOUSEHOLD
0.0/ 100
METRIC RATING
302nd/ 347
METRIC RANK
16.6%
NO VEHICLES IN HOUSEHOLD
0.0/ 100
METRIC RATING
317th/ 347
METRIC RANK
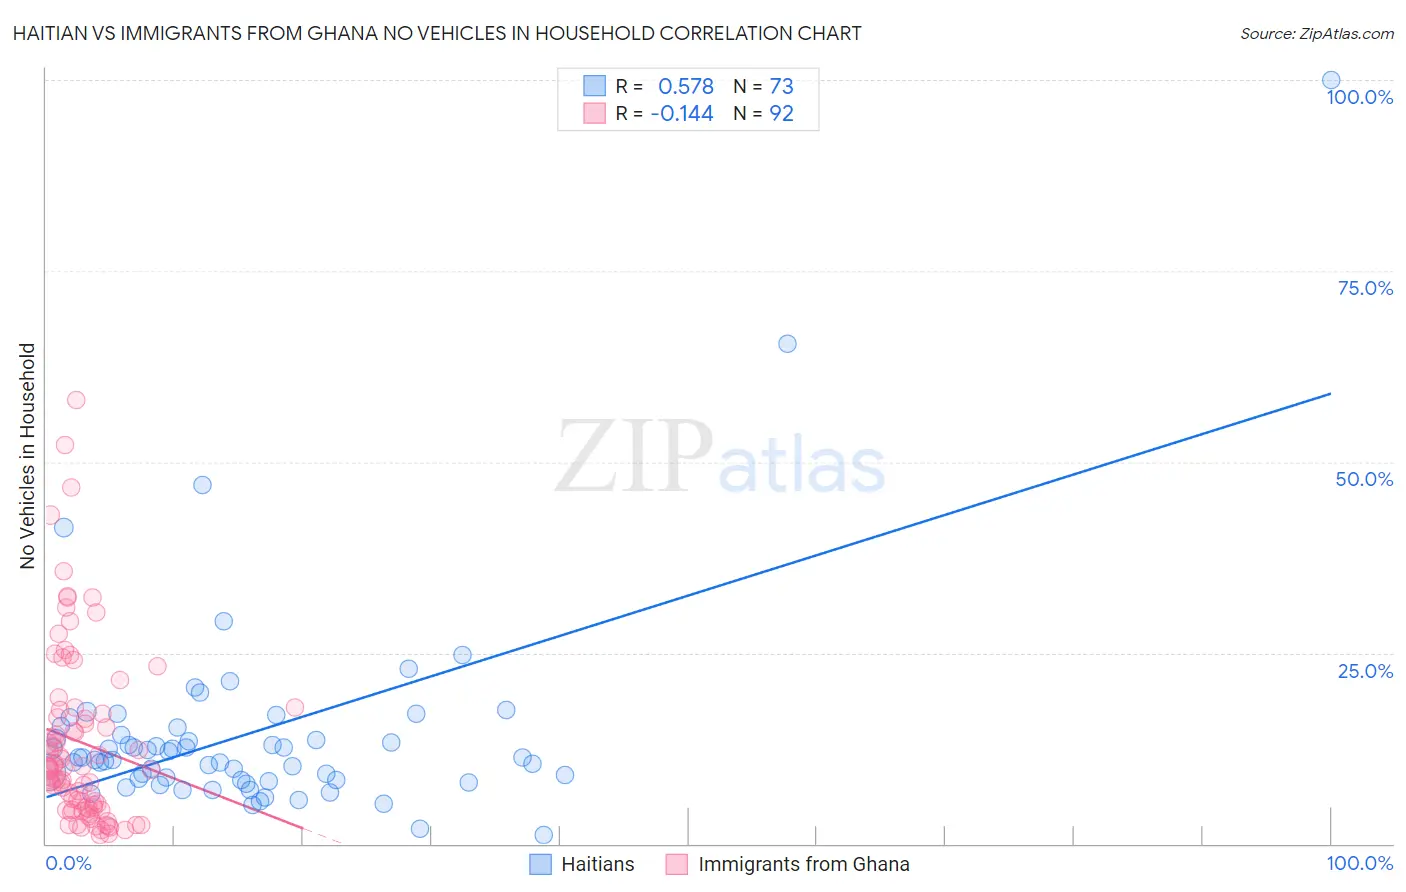
Haitian vs Immigrants from Ghana No Vehicles in Household Correlation Chart
The statistical analysis conducted on geographies consisting of 287,450,258 people shows a substantial positive correlation between the proportion of Haitians and percentage of households with no vehicle available in the United States with a correlation coefficient (R) of 0.578 and weighted average of 14.9%. Similarly, the statistical analysis conducted on geographies consisting of 199,471,025 people shows a poor negative correlation between the proportion of Immigrants from Ghana and percentage of households with no vehicle available in the United States with a correlation coefficient (R) of -0.144 and weighted average of 16.6%, a difference of 11.3%.
No Vehicles in Household Correlation Summary
| Measurement | Haitian | Immigrants from Ghana |
| Minimum | 1.2% | 1.2% |
| Maximum | 100.0% | 58.0% |
| Range | 98.8% | 56.8% |
| Mean | 14.5% | 13.3% |
| Median | 11.3% | 9.8% |
| Interquartile 25% (IQ1) | 8.4% | 4.6% |
| Interquartile 75% (IQ3) | 14.7% | 17.3% |
| Interquartile Range (IQR) | 6.3% | 12.7% |
| Standard Deviation (Sample) | 13.9% | 11.8% |
| Standard Deviation (Population) | 13.8% | 11.7% |
Demographics Similar to Haitians and Immigrants from Ghana by No Vehicles in Household
In terms of no vehicles in household, the demographic groups most similar to Haitians are Immigrants from Ukraine (14.9%, a difference of 0.47%), Yuman (14.9%, a difference of 0.48%), Immigrants from Western Africa (15.0%, a difference of 0.52%), Immigrants from Russia (15.1%, a difference of 1.2%), and Immigrants from Greece (14.7%, a difference of 1.5%). Similarly, the demographic groups most similar to Immigrants from Ghana are Immigrants from Belarus (16.7%, a difference of 0.86%), Ghanaian (16.4%, a difference of 0.95%), Alaska Native (17.4%, a difference of 4.8%), Cypriot (15.7%, a difference of 6.0%), and Albanian (15.6%, a difference of 6.1%).
| Demographics | Rating | Rank | No Vehicles in Household |
| Immigrants | Greece | 0.0 /100 | #299 | Tragic 14.7% |
| Yuman | 0.0 /100 | #300 | Tragic 14.9% |
| Immigrants | Ukraine | 0.0 /100 | #301 | Tragic 14.9% |
| Haitians | 0.0 /100 | #302 | Tragic 14.9% |
| Immigrants | Western Africa | 0.0 /100 | #303 | Tragic 15.0% |
| Immigrants | Russia | 0.0 /100 | #304 | Tragic 15.1% |
| Immigrants | China | 0.0 /100 | #305 | Tragic 15.2% |
| Immigrants | Belize | 0.0 /100 | #306 | Tragic 15.4% |
| Immigrants | Haiti | 0.0 /100 | #307 | Tragic 15.4% |
| U.S. Virgin Islanders | 0.0 /100 | #308 | Tragic 15.4% |
| Puerto Ricans | 0.0 /100 | #309 | Tragic 15.5% |
| Cape Verdeans | 0.0 /100 | #310 | Tragic 15.6% |
| Immigrants | Israel | 0.0 /100 | #311 | Tragic 15.6% |
| Alaskan Athabascans | 0.0 /100 | #312 | Tragic 15.6% |
| Tohono O'odham | 0.0 /100 | #313 | Tragic 15.6% |
| Albanians | 0.0 /100 | #314 | Tragic 15.6% |
| Cypriots | 0.0 /100 | #315 | Tragic 15.7% |
| Ghanaians | 0.0 /100 | #316 | Tragic 16.4% |
| Immigrants | Ghana | 0.0 /100 | #317 | Tragic 16.6% |
| Immigrants | Belarus | 0.0 /100 | #318 | Tragic 16.7% |
| Alaska Natives | 0.0 /100 | #319 | Tragic 17.4% |