Swedish vs Immigrants from Netherlands Family Poverty
COMPARE
Swedish
Immigrants from Netherlands
Family Poverty
Family Poverty Comparison
Swedes
Immigrants from Netherlands
7.1%
FAMILY POVERTY
99.8/ 100
METRIC RATING
13th/ 347
METRIC RANK
7.7%
FAMILY POVERTY
98.6/ 100
METRIC RATING
61st/ 347
METRIC RANK
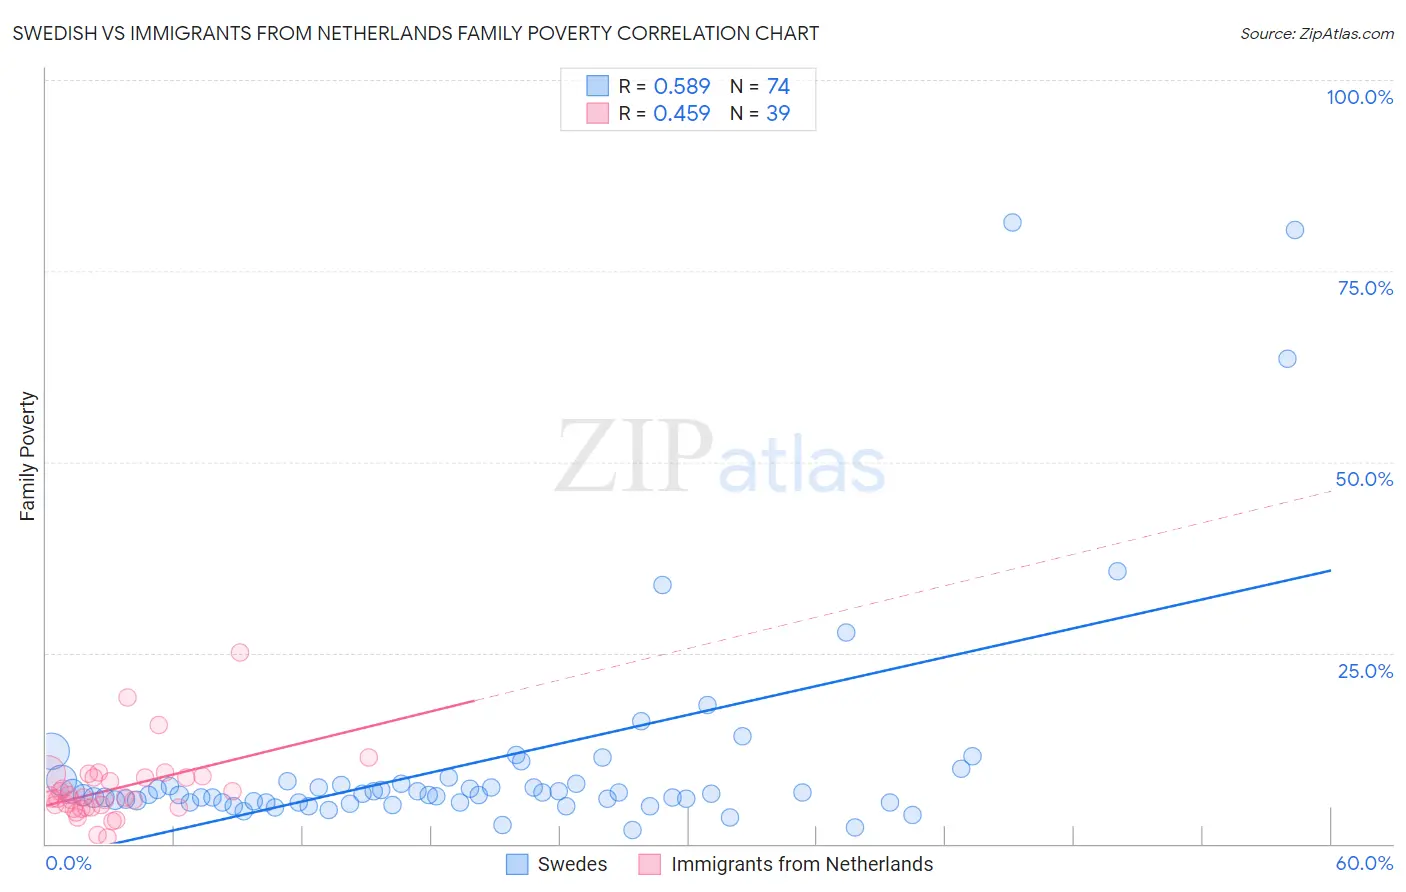
Swedish vs Immigrants from Netherlands Family Poverty Correlation Chart
The statistical analysis conducted on geographies consisting of 535,382,987 people shows a substantial positive correlation between the proportion of Swedes and poverty level among families in the United States with a correlation coefficient (R) of 0.589 and weighted average of 7.1%. Similarly, the statistical analysis conducted on geographies consisting of 237,430,105 people shows a moderate positive correlation between the proportion of Immigrants from Netherlands and poverty level among families in the United States with a correlation coefficient (R) of 0.459 and weighted average of 7.7%, a difference of 8.8%.
Family Poverty Correlation Summary
| Measurement | Swedish | Immigrants from Netherlands |
| Minimum | 1.8% | 0.78% |
| Maximum | 81.3% | 25.0% |
| Range | 79.6% | 24.2% |
| Mean | 10.7% | 7.2% |
| Median | 6.5% | 6.1% |
| Interquartile 25% (IQ1) | 5.4% | 4.7% |
| Interquartile 75% (IQ3) | 7.9% | 8.7% |
| Interquartile Range (IQR) | 2.5% | 4.0% |
| Standard Deviation (Sample) | 14.6% | 4.5% |
| Standard Deviation (Population) | 14.5% | 4.4% |
Similar Demographics by Family Poverty
Demographics Similar to Swedes by Family Poverty
In terms of family poverty, the demographic groups most similar to Swedes are Iranian (7.1%, a difference of 0.010%), Maltese (7.1%, a difference of 0.050%), Immigrants from Singapore (7.1%, a difference of 0.34%), Bulgarian (7.1%, a difference of 0.35%), and Latvian (7.1%, a difference of 0.60%).
| Demographics | Rating | Rank | Family Poverty |
| Norwegians | 99.9 /100 | #6 | Exceptional 6.9% |
| Immigrants | Ireland | 99.9 /100 | #7 | Exceptional 7.0% |
| Bhutanese | 99.9 /100 | #8 | Exceptional 7.0% |
| Latvians | 99.9 /100 | #9 | Exceptional 7.1% |
| Bulgarians | 99.8 /100 | #10 | Exceptional 7.1% |
| Immigrants | Singapore | 99.8 /100 | #11 | Exceptional 7.1% |
| Maltese | 99.8 /100 | #12 | Exceptional 7.1% |
| Swedes | 99.8 /100 | #13 | Exceptional 7.1% |
| Iranians | 99.8 /100 | #14 | Exceptional 7.1% |
| Lithuanians | 99.8 /100 | #15 | Exceptional 7.2% |
| Immigrants | South Central Asia | 99.8 /100 | #16 | Exceptional 7.2% |
| Luxembourgers | 99.8 /100 | #17 | Exceptional 7.2% |
| Immigrants | Lithuania | 99.8 /100 | #18 | Exceptional 7.2% |
| Eastern Europeans | 99.7 /100 | #19 | Exceptional 7.2% |
| Immigrants | Hong Kong | 99.7 /100 | #20 | Exceptional 7.3% |
Demographics Similar to Immigrants from Netherlands by Family Poverty
In terms of family poverty, the demographic groups most similar to Immigrants from Netherlands are Immigrants from Greece (7.7%, a difference of 0.18%), European (7.7%, a difference of 0.19%), Macedonian (7.8%, a difference of 0.19%), Finnish (7.7%, a difference of 0.20%), and Asian (7.7%, a difference of 0.23%).
| Demographics | Rating | Rank | Family Poverty |
| Immigrants | Sweden | 98.8 /100 | #54 | Exceptional 7.7% |
| Immigrants | Eastern Asia | 98.7 /100 | #55 | Exceptional 7.7% |
| Immigrants | Serbia | 98.7 /100 | #56 | Exceptional 7.7% |
| Asians | 98.7 /100 | #57 | Exceptional 7.7% |
| Finns | 98.7 /100 | #58 | Exceptional 7.7% |
| Europeans | 98.7 /100 | #59 | Exceptional 7.7% |
| Immigrants | Greece | 98.7 /100 | #60 | Exceptional 7.7% |
| Immigrants | Netherlands | 98.6 /100 | #61 | Exceptional 7.7% |
| Macedonians | 98.6 /100 | #62 | Exceptional 7.8% |
| Zimbabweans | 98.4 /100 | #63 | Exceptional 7.8% |
| Koreans | 98.3 /100 | #64 | Exceptional 7.8% |
| Immigrants | Bulgaria | 98.3 /100 | #65 | Exceptional 7.8% |
| Dutch | 98.3 /100 | #66 | Exceptional 7.8% |
| Northern Europeans | 98.3 /100 | #67 | Exceptional 7.8% |
| Australians | 98.2 /100 | #68 | Exceptional 7.8% |