Guatemalan vs Immigrants from Costa Rica Single Mother Poverty
COMPARE
Guatemalan
Immigrants from Costa Rica
Single Mother Poverty
Single Mother Poverty Comparison
Guatemalans
Immigrants from Costa Rica
32.9%
SINGLE MOTHER POVERTY
0.0/ 100
METRIC RATING
291st/ 347
METRIC RANK
29.2%
SINGLE MOTHER POVERTY
48.8/ 100
METRIC RATING
175th/ 347
METRIC RANK
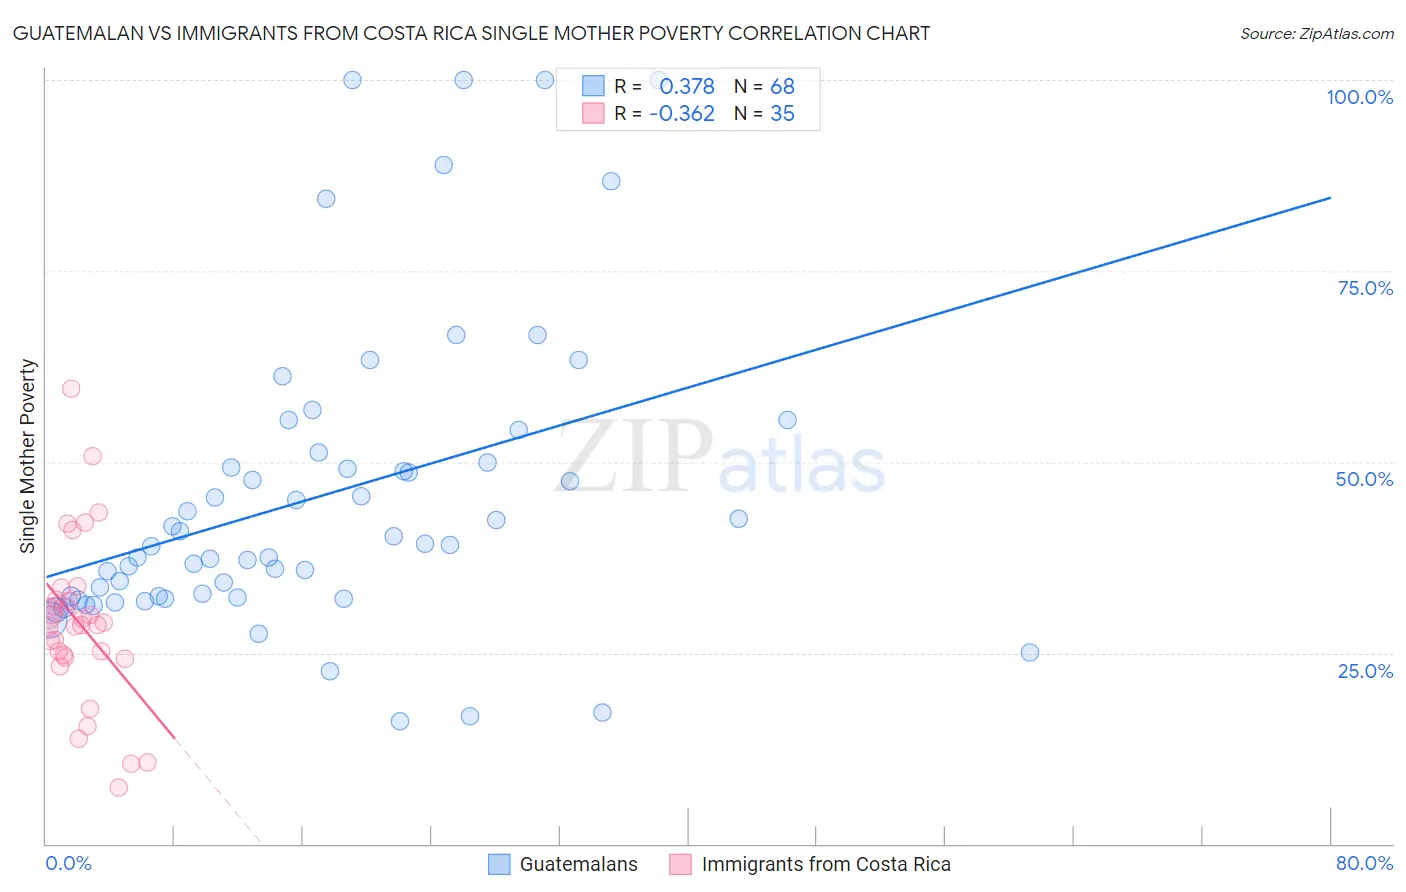
Guatemalan vs Immigrants from Costa Rica Single Mother Poverty Correlation Chart
The statistical analysis conducted on geographies consisting of 401,916,262 people shows a mild positive correlation between the proportion of Guatemalans and poverty level among single mothers in the United States with a correlation coefficient (R) of 0.378 and weighted average of 32.9%. Similarly, the statistical analysis conducted on geographies consisting of 201,853,428 people shows a mild negative correlation between the proportion of Immigrants from Costa Rica and poverty level among single mothers in the United States with a correlation coefficient (R) of -0.362 and weighted average of 29.2%, a difference of 12.7%.
Single Mother Poverty Correlation Summary
| Measurement | Guatemalan | Immigrants from Costa Rica |
| Minimum | 16.0% | 7.4% |
| Maximum | 100.0% | 59.6% |
| Range | 84.0% | 52.2% |
| Mean | 45.6% | 28.9% |
| Median | 39.2% | 28.6% |
| Interquartile 25% (IQ1) | 32.3% | 24.4% |
| Interquartile 75% (IQ3) | 50.6% | 31.9% |
| Interquartile Range (IQR) | 18.3% | 7.4% |
| Standard Deviation (Sample) | 20.1% | 10.9% |
| Standard Deviation (Population) | 19.9% | 10.7% |
Similar Demographics by Single Mother Poverty
Demographics Similar to Guatemalans by Single Mother Poverty
In terms of single mother poverty, the demographic groups most similar to Guatemalans are Shoshone (32.9%, a difference of 0.020%), Aleut (32.9%, a difference of 0.050%), French American Indian (33.1%, a difference of 0.68%), Yaqui (33.1%, a difference of 0.72%), and Blackfeet (33.2%, a difference of 0.88%).
| Demographics | Rating | Rank | Single Mother Poverty |
| Indonesians | 0.0 /100 | #284 | Tragic 32.4% |
| Immigrants | Latin America | 0.0 /100 | #285 | Tragic 32.4% |
| Yup'ik | 0.0 /100 | #286 | Tragic 32.5% |
| Immigrants | Dominica | 0.0 /100 | #287 | Tragic 32.5% |
| Somalis | 0.0 /100 | #288 | Tragic 32.6% |
| U.S. Virgin Islanders | 0.0 /100 | #289 | Tragic 32.6% |
| Osage | 0.0 /100 | #290 | Tragic 32.6% |
| Guatemalans | 0.0 /100 | #291 | Tragic 32.9% |
| Shoshone | 0.0 /100 | #292 | Tragic 32.9% |
| Aleuts | 0.0 /100 | #293 | Tragic 32.9% |
| French American Indians | 0.0 /100 | #294 | Tragic 33.1% |
| Yaqui | 0.0 /100 | #295 | Tragic 33.1% |
| Blackfeet | 0.0 /100 | #296 | Tragic 33.2% |
| Pennsylvania Germans | 0.0 /100 | #297 | Tragic 33.2% |
| Africans | 0.0 /100 | #298 | Tragic 33.3% |
Demographics Similar to Immigrants from Costa Rica by Single Mother Poverty
In terms of single mother poverty, the demographic groups most similar to Immigrants from Costa Rica are Hawaiian (29.2%, a difference of 0.040%), Immigrants from Saudi Arabia (29.2%, a difference of 0.060%), British (29.2%, a difference of 0.090%), Immigrants from Bosnia and Herzegovina (29.2%, a difference of 0.17%), and Carpatho Rusyn (29.1%, a difference of 0.24%).
| Demographics | Rating | Rank | Single Mother Poverty |
| Europeans | 57.6 /100 | #168 | Average 29.1% |
| Immigrants | Uruguay | 57.2 /100 | #169 | Average 29.1% |
| New Zealanders | 55.1 /100 | #170 | Average 29.1% |
| Puget Sound Salish | 55.1 /100 | #171 | Average 29.1% |
| Carpatho Rusyns | 53.8 /100 | #172 | Average 29.1% |
| British | 50.6 /100 | #173 | Average 29.2% |
| Immigrants | Saudi Arabia | 50.0 /100 | #174 | Average 29.2% |
| Immigrants | Costa Rica | 48.8 /100 | #175 | Average 29.2% |
| Hawaiians | 47.8 /100 | #176 | Average 29.2% |
| Immigrants | Bosnia and Herzegovina | 45.1 /100 | #177 | Average 29.2% |
| South American Indians | 43.2 /100 | #178 | Average 29.3% |
| Immigrants | Uzbekistan | 42.6 /100 | #179 | Average 29.3% |
| Immigrants | Norway | 41.5 /100 | #180 | Average 29.3% |
| Canadians | 40.4 /100 | #181 | Average 29.3% |
| Immigrants | Eastern Africa | 38.5 /100 | #182 | Fair 29.3% |