Guatemalan vs Sri Lankan 3rd Grade
COMPARE
Guatemalan
Sri Lankan
3rd Grade
3rd Grade Comparison
Guatemalans
Sri Lankans
96.0%
3RD GRADE
0.0/ 100
METRIC RATING
338th/ 347
METRIC RANK
96.7%
3RD GRADE
0.0/ 100
METRIC RATING
309th/ 347
METRIC RANK
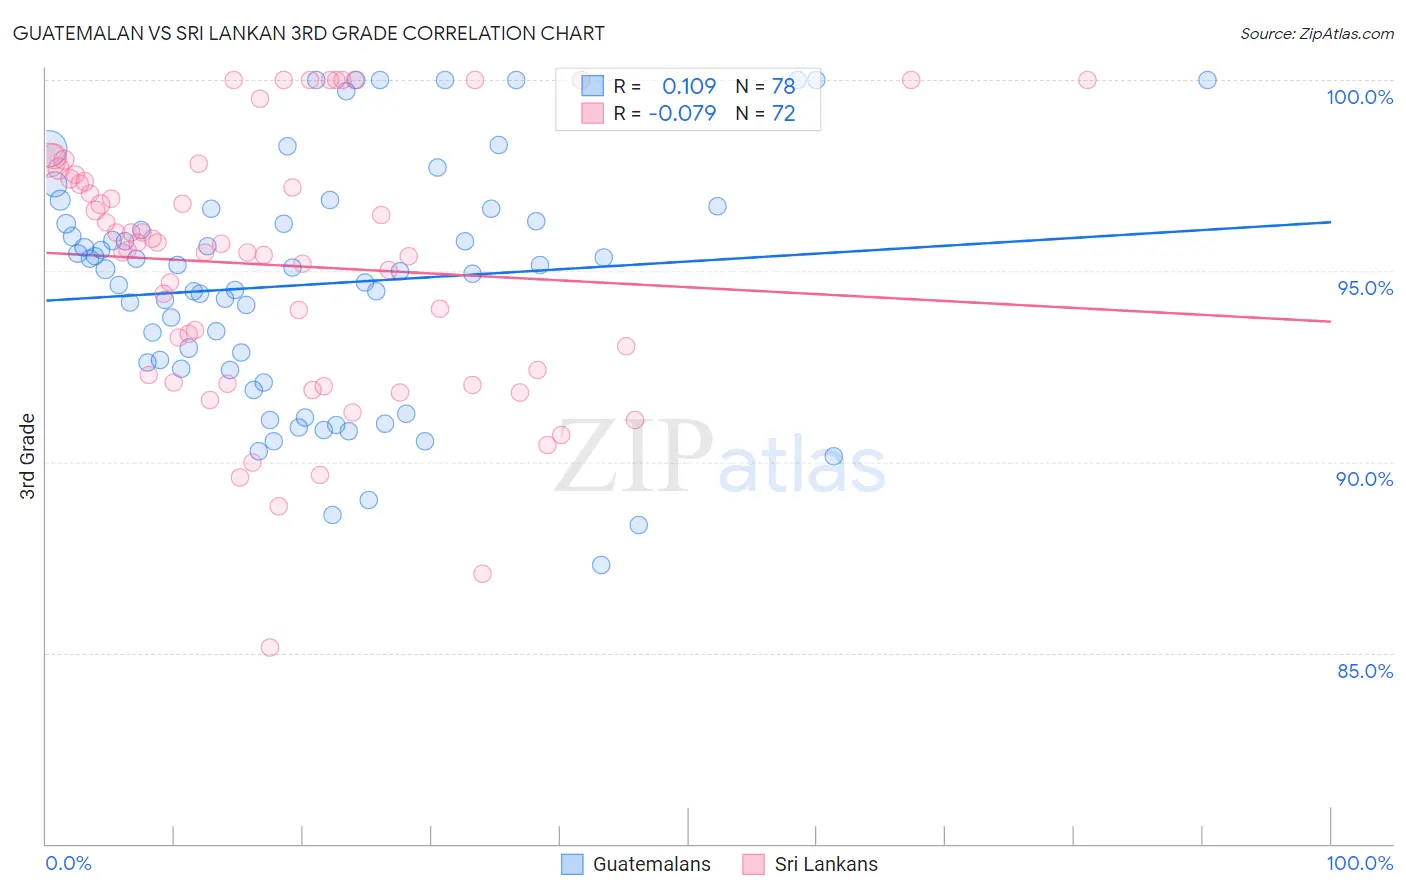
Guatemalan vs Sri Lankan 3rd Grade Correlation Chart
The statistical analysis conducted on geographies consisting of 409,566,469 people shows a poor positive correlation between the proportion of Guatemalans and percentage of population with at least 3rd grade education in the United States with a correlation coefficient (R) of 0.109 and weighted average of 96.0%. Similarly, the statistical analysis conducted on geographies consisting of 440,593,746 people shows a slight negative correlation between the proportion of Sri Lankans and percentage of population with at least 3rd grade education in the United States with a correlation coefficient (R) of -0.079 and weighted average of 96.7%, a difference of 0.73%.
3rd Grade Correlation Summary
| Measurement | Guatemalan | Sri Lankan |
| Minimum | 87.3% | 85.2% |
| Maximum | 100.0% | 100.0% |
| Range | 12.7% | 14.8% |
| Mean | 94.6% | 95.1% |
| Median | 95.0% | 95.6% |
| Interquartile 25% (IQ1) | 92.4% | 92.2% |
| Interquartile 75% (IQ3) | 96.3% | 97.5% |
| Interquartile Range (IQR) | 3.9% | 5.3% |
| Standard Deviation (Sample) | 3.1% | 3.4% |
| Standard Deviation (Population) | 3.1% | 3.4% |
Similar Demographics by 3rd Grade
Demographics Similar to Guatemalans by 3rd Grade
In terms of 3rd grade, the demographic groups most similar to Guatemalans are Yakama (95.9%, a difference of 0.030%), Nepalese (95.9%, a difference of 0.11%), Central American (96.1%, a difference of 0.12%), Immigrants from Central America (95.8%, a difference of 0.17%), and Immigrants from Guatemala (95.8%, a difference of 0.17%).
| Demographics | Rating | Rank | 3rd Grade |
| Immigrants | Latin America | 0.0 /100 | #331 | Tragic 96.2% |
| Mexicans | 0.0 /100 | #332 | Tragic 96.2% |
| Immigrants | Fiji | 0.0 /100 | #333 | Tragic 96.2% |
| Immigrants | Cambodia | 0.0 /100 | #334 | Tragic 96.2% |
| Immigrants | Dominican Republic | 0.0 /100 | #335 | Tragic 96.2% |
| Immigrants | Cabo Verde | 0.0 /100 | #336 | Tragic 96.2% |
| Central Americans | 0.0 /100 | #337 | Tragic 96.1% |
| Guatemalans | 0.0 /100 | #338 | Tragic 96.0% |
| Yakama | 0.0 /100 | #339 | Tragic 95.9% |
| Nepalese | 0.0 /100 | #340 | Tragic 95.9% |
| Immigrants | Central America | 0.0 /100 | #341 | Tragic 95.8% |
| Immigrants | Guatemala | 0.0 /100 | #342 | Tragic 95.8% |
| Immigrants | Mexico | 0.0 /100 | #343 | Tragic 95.8% |
| Salvadorans | 0.0 /100 | #344 | Tragic 95.7% |
| Immigrants | Yemen | 0.0 /100 | #345 | Tragic 95.6% |
Demographics Similar to Sri Lankans by 3rd Grade
In terms of 3rd grade, the demographic groups most similar to Sri Lankans are Nicaraguan (96.7%, a difference of 0.0%), Immigrants from Haiti (96.7%, a difference of 0.0%), Guyanese (96.7%, a difference of 0.020%), Cape Verdean (96.6%, a difference of 0.030%), and Central American Indian (96.7%, a difference of 0.050%).
| Demographics | Rating | Rank | 3rd Grade |
| Immigrants | Somalia | 0.0 /100 | #302 | Tragic 96.8% |
| Ecuadorians | 0.0 /100 | #303 | Tragic 96.7% |
| Immigrants | Caribbean | 0.0 /100 | #304 | Tragic 96.7% |
| Central American Indians | 0.0 /100 | #305 | Tragic 96.7% |
| Guyanese | 0.0 /100 | #306 | Tragic 96.7% |
| Nicaraguans | 0.0 /100 | #307 | Tragic 96.7% |
| Immigrants | Haiti | 0.0 /100 | #308 | Tragic 96.7% |
| Sri Lankans | 0.0 /100 | #309 | Tragic 96.7% |
| Cape Verdeans | 0.0 /100 | #310 | Tragic 96.6% |
| Immigrants | Guyana | 0.0 /100 | #311 | Tragic 96.6% |
| Immigrants | Laos | 0.0 /100 | #312 | Tragic 96.6% |
| Immigrants | Ecuador | 0.0 /100 | #313 | Tragic 96.6% |
| Belizeans | 0.0 /100 | #314 | Tragic 96.6% |
| Immigrants | Azores | 0.0 /100 | #315 | Tragic 96.6% |
| Immigrants | Burma/Myanmar | 0.0 /100 | #316 | Tragic 96.6% |