Guatemalan vs Immigrants from Kenya Female Poverty
COMPARE
Guatemalan
Immigrants from Kenya
Female Poverty
Female Poverty Comparison
Guatemalans
Immigrants from Kenya
16.7%
FEMALE POVERTY
0.0/ 100
METRIC RATING
301st/ 347
METRIC RANK
13.9%
FEMALE POVERTY
21.1/ 100
METRIC RATING
201st/ 347
METRIC RANK
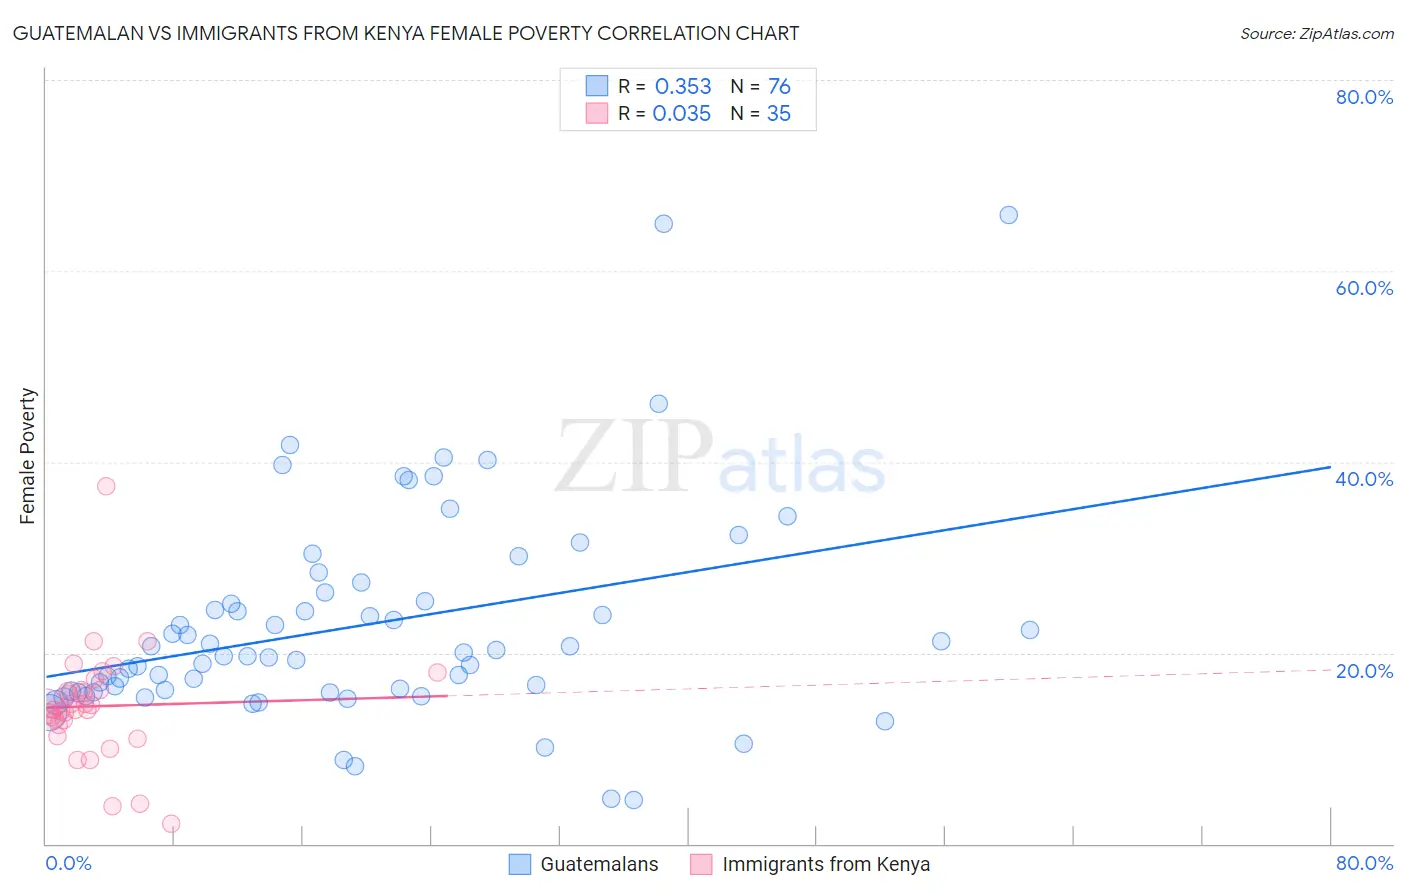
Guatemalan vs Immigrants from Kenya Female Poverty Correlation Chart
The statistical analysis conducted on geographies consisting of 409,219,734 people shows a mild positive correlation between the proportion of Guatemalans and poverty level among females in the United States with a correlation coefficient (R) of 0.353 and weighted average of 16.7%. Similarly, the statistical analysis conducted on geographies consisting of 217,949,834 people shows no correlation between the proportion of Immigrants from Kenya and poverty level among females in the United States with a correlation coefficient (R) of 0.035 and weighted average of 13.9%, a difference of 20.4%.
Female Poverty Correlation Summary
| Measurement | Guatemalan | Immigrants from Kenya |
| Minimum | 4.6% | 2.1% |
| Maximum | 65.8% | 37.4% |
| Range | 61.2% | 35.3% |
| Mean | 22.9% | 14.4% |
| Median | 19.8% | 14.1% |
| Interquartile 25% (IQ1) | 15.9% | 12.5% |
| Interquartile 75% (IQ3) | 25.8% | 16.2% |
| Interquartile Range (IQR) | 9.9% | 3.7% |
| Standard Deviation (Sample) | 11.3% | 5.9% |
| Standard Deviation (Population) | 11.2% | 5.8% |
Similar Demographics by Female Poverty
Demographics Similar to Guatemalans by Female Poverty
In terms of female poverty, the demographic groups most similar to Guatemalans are Chippewa (16.7%, a difference of 0.030%), Bahamian (16.6%, a difference of 0.33%), Hispanic or Latino (16.6%, a difference of 0.38%), Choctaw (16.8%, a difference of 0.63%), and Immigrants from Central America (16.8%, a difference of 0.70%).
| Demographics | Rating | Rank | Female Poverty |
| Immigrants | Cabo Verde | 0.0 /100 | #294 | Tragic 16.4% |
| Senegalese | 0.0 /100 | #295 | Tragic 16.5% |
| Immigrants | Senegal | 0.0 /100 | #296 | Tragic 16.5% |
| Mexicans | 0.0 /100 | #297 | Tragic 16.5% |
| Somalis | 0.0 /100 | #298 | Tragic 16.6% |
| Hispanics or Latinos | 0.0 /100 | #299 | Tragic 16.6% |
| Bahamians | 0.0 /100 | #300 | Tragic 16.6% |
| Guatemalans | 0.0 /100 | #301 | Tragic 16.7% |
| Chippewa | 0.0 /100 | #302 | Tragic 16.7% |
| Choctaw | 0.0 /100 | #303 | Tragic 16.8% |
| Immigrants | Central America | 0.0 /100 | #304 | Tragic 16.8% |
| Immigrants | Grenada | 0.0 /100 | #305 | Tragic 16.8% |
| Immigrants | Caribbean | 0.0 /100 | #306 | Tragic 16.9% |
| Seminole | 0.0 /100 | #307 | Tragic 16.9% |
| Africans | 0.0 /100 | #308 | Tragic 16.9% |
Demographics Similar to Immigrants from Kenya by Female Poverty
In terms of female poverty, the demographic groups most similar to Immigrants from Kenya are Hmong (13.9%, a difference of 0.010%), Spanish (13.9%, a difference of 0.040%), Immigrants from Western Asia (13.9%, a difference of 0.060%), Spaniard (13.9%, a difference of 0.33%), and Immigrants from Lebanon (13.8%, a difference of 0.59%).
| Demographics | Rating | Rank | Female Poverty |
| Delaware | 31.1 /100 | #194 | Fair 13.7% |
| Immigrants | South America | 30.6 /100 | #195 | Fair 13.7% |
| South American Indians | 28.9 /100 | #196 | Fair 13.7% |
| Arabs | 28.6 /100 | #197 | Fair 13.7% |
| Immigrants | Uganda | 28.5 /100 | #198 | Fair 13.7% |
| Immigrants | Lebanon | 25.6 /100 | #199 | Fair 13.8% |
| Spanish | 21.4 /100 | #200 | Fair 13.9% |
| Immigrants | Kenya | 21.1 /100 | #201 | Fair 13.9% |
| Hmong | 21.1 /100 | #202 | Fair 13.9% |
| Immigrants | Western Asia | 20.7 /100 | #203 | Fair 13.9% |
| Spaniards | 18.9 /100 | #204 | Poor 13.9% |
| Ugandans | 15.4 /100 | #205 | Poor 14.0% |
| Immigrants | Uruguay | 14.0 /100 | #206 | Poor 14.0% |
| Immigrants | Eastern Africa | 9.0 /100 | #207 | Tragic 14.2% |
| Immigrants | Azores | 7.9 /100 | #208 | Tragic 14.2% |