Guatemalan vs Immigrants from Jordan 11th Grade
COMPARE
Guatemalan
Immigrants from Jordan
11th Grade
11th Grade Comparison
Guatemalans
Immigrants from Jordan
86.4%
11TH GRADE
0.0/ 100
METRIC RATING
339th/ 347
METRIC RANK
93.1%
11TH GRADE
92.4/ 100
METRIC RATING
128th/ 347
METRIC RANK
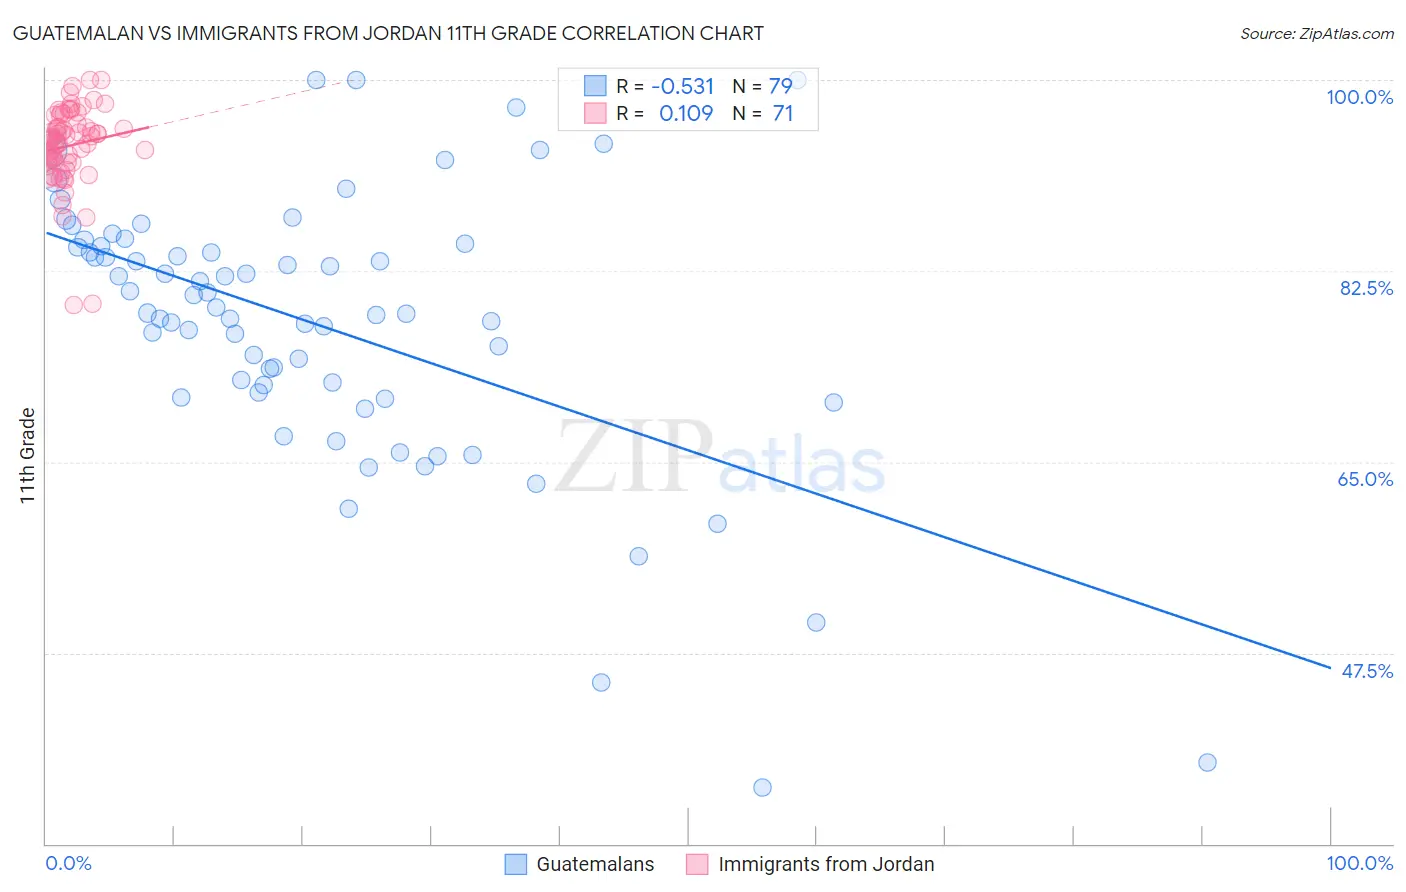
Guatemalan vs Immigrants from Jordan 11th Grade Correlation Chart
The statistical analysis conducted on geographies consisting of 409,566,618 people shows a substantial negative correlation between the proportion of Guatemalans and percentage of population with at least 11th grade education in the United States with a correlation coefficient (R) of -0.531 and weighted average of 86.4%. Similarly, the statistical analysis conducted on geographies consisting of 181,278,272 people shows a poor positive correlation between the proportion of Immigrants from Jordan and percentage of population with at least 11th grade education in the United States with a correlation coefficient (R) of 0.109 and weighted average of 93.1%, a difference of 7.8%.
11th Grade Correlation Summary
| Measurement | Guatemalan | Immigrants from Jordan |
| Minimum | 35.2% | 79.3% |
| Maximum | 100.0% | 100.0% |
| Range | 64.8% | 20.7% |
| Mean | 77.6% | 94.0% |
| Median | 78.6% | 94.6% |
| Interquartile 25% (IQ1) | 71.4% | 92.5% |
| Interquartile 75% (IQ3) | 84.8% | 96.0% |
| Interquartile Range (IQR) | 13.4% | 3.5% |
| Standard Deviation (Sample) | 12.6% | 3.7% |
| Standard Deviation (Population) | 12.5% | 3.7% |
Similar Demographics by 11th Grade
Demographics Similar to Guatemalans by 11th Grade
In terms of 11th grade, the demographic groups most similar to Guatemalans are Salvadoran (86.2%, a difference of 0.23%), Mexican (86.1%, a difference of 0.29%), Immigrants from Latin America (86.8%, a difference of 0.49%), Immigrants from Honduras (86.9%, a difference of 0.61%), and Immigrants from Dominican Republic (86.9%, a difference of 0.62%).
| Demographics | Rating | Rank | 11th Grade |
| Immigrants | Azores | 0.0 /100 | #332 | Tragic 87.2% |
| Immigrants | Yemen | 0.0 /100 | #333 | Tragic 87.1% |
| Houma | 0.0 /100 | #334 | Tragic 87.0% |
| Central Americans | 0.0 /100 | #335 | Tragic 86.9% |
| Immigrants | Dominican Republic | 0.0 /100 | #336 | Tragic 86.9% |
| Immigrants | Honduras | 0.0 /100 | #337 | Tragic 86.9% |
| Immigrants | Latin America | 0.0 /100 | #338 | Tragic 86.8% |
| Guatemalans | 0.0 /100 | #339 | Tragic 86.4% |
| Salvadorans | 0.0 /100 | #340 | Tragic 86.2% |
| Mexicans | 0.0 /100 | #341 | Tragic 86.1% |
| Immigrants | Guatemala | 0.0 /100 | #342 | Tragic 85.8% |
| Immigrants | El Salvador | 0.0 /100 | #343 | Tragic 85.3% |
| Yakama | 0.0 /100 | #344 | Tragic 85.0% |
| Immigrants | Central America | 0.0 /100 | #345 | Tragic 84.9% |
| Spanish American Indians | 0.0 /100 | #346 | Tragic 84.7% |
Demographics Similar to Immigrants from Jordan by 11th Grade
In terms of 11th grade, the demographic groups most similar to Immigrants from Jordan are Immigrants from Kazakhstan (93.1%, a difference of 0.0%), Immigrants from Ukraine (93.0%, a difference of 0.080%), Albanian (93.0%, a difference of 0.090%), Egyptian (93.0%, a difference of 0.090%), and Immigrants from Bosnia and Herzegovina (93.0%, a difference of 0.10%).
| Demographics | Rating | Rank | 11th Grade |
| German Russians | 96.4 /100 | #121 | Exceptional 93.3% |
| Immigrants | Belarus | 96.3 /100 | #122 | Exceptional 93.3% |
| Immigrants | Greece | 95.9 /100 | #123 | Exceptional 93.2% |
| Immigrants | Eastern Europe | 95.9 /100 | #124 | Exceptional 93.2% |
| Immigrants | Sri Lanka | 95.6 /100 | #125 | Exceptional 93.2% |
| Basques | 95.2 /100 | #126 | Exceptional 93.2% |
| Immigrants | Kazakhstan | 92.4 /100 | #127 | Exceptional 93.1% |
| Immigrants | Jordan | 92.4 /100 | #128 | Exceptional 93.1% |
| Immigrants | Ukraine | 89.8 /100 | #129 | Excellent 93.0% |
| Albanians | 89.5 /100 | #130 | Excellent 93.0% |
| Egyptians | 89.5 /100 | #131 | Excellent 93.0% |
| Immigrants | Bosnia and Herzegovina | 89.0 /100 | #132 | Excellent 93.0% |
| Mongolians | 87.6 /100 | #133 | Excellent 93.0% |
| Delaware | 87.3 /100 | #134 | Excellent 93.0% |
| Immigrants | Italy | 86.6 /100 | #135 | Excellent 92.9% |