Guatemalan vs African Male Poverty
COMPARE
Guatemalan
African
Male Poverty
Male Poverty Comparison
Guatemalans
Africans
13.8%
MALE POVERTY
0.0/ 100
METRIC RATING
289th/ 347
METRIC RANK
14.2%
MALE POVERTY
0.0/ 100
METRIC RATING
308th/ 347
METRIC RANK
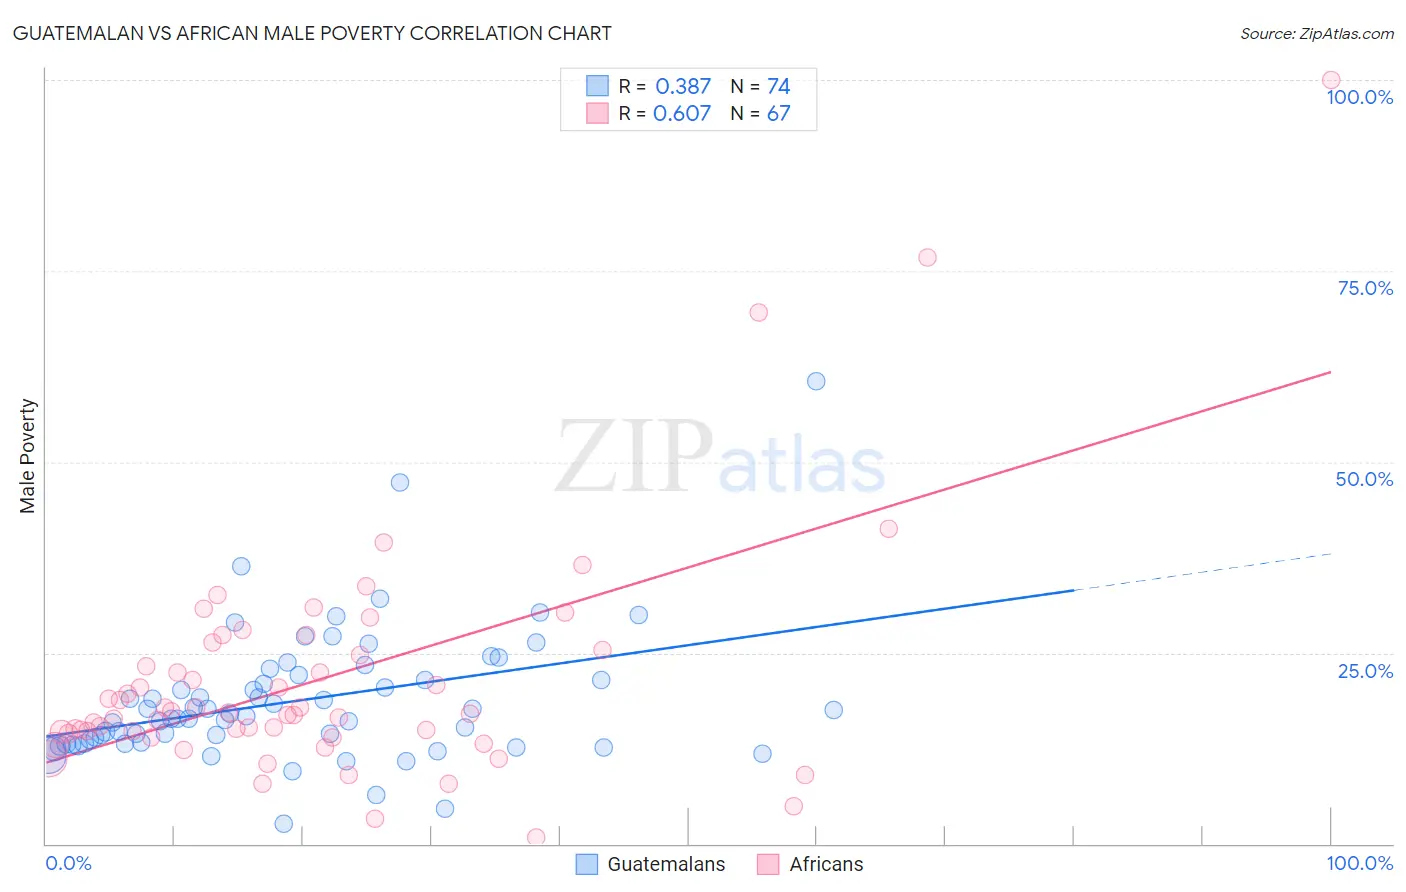
Guatemalan vs African Male Poverty Correlation Chart
The statistical analysis conducted on geographies consisting of 409,206,123 people shows a mild positive correlation between the proportion of Guatemalans and poverty level among males in the United States with a correlation coefficient (R) of 0.387 and weighted average of 13.8%. Similarly, the statistical analysis conducted on geographies consisting of 469,483,422 people shows a significant positive correlation between the proportion of Africans and poverty level among males in the United States with a correlation coefficient (R) of 0.607 and weighted average of 14.2%, a difference of 2.9%.
Male Poverty Correlation Summary
| Measurement | Guatemalan | African |
| Minimum | 2.7% | 0.81% |
| Maximum | 60.5% | 100.0% |
| Range | 57.9% | 99.2% |
| Mean | 18.7% | 21.5% |
| Median | 16.6% | 17.0% |
| Interquartile 25% (IQ1) | 13.1% | 14.4% |
| Interquartile 75% (IQ3) | 21.5% | 25.4% |
| Interquartile Range (IQR) | 8.4% | 10.9% |
| Standard Deviation (Sample) | 8.7% | 15.8% |
| Standard Deviation (Population) | 8.7% | 15.7% |
Demographics Similar to Guatemalans and Africans by Male Poverty
In terms of male poverty, the demographic groups most similar to Guatemalans are Immigrants from Zaire (13.8%, a difference of 0.010%), Vietnamese (13.8%, a difference of 0.10%), Immigrants from St. Vincent and the Grenadines (13.8%, a difference of 0.17%), Indonesian (13.8%, a difference of 0.26%), and Immigrants from Belize (13.8%, a difference of 0.27%). Similarly, the demographic groups most similar to Africans are Dutch West Indian (14.2%, a difference of 0.020%), Creek (14.1%, a difference of 0.71%), Immigrants from Bangladesh (14.1%, a difference of 0.78%), Senegalese (14.1%, a difference of 1.0%), and Bahamian (14.1%, a difference of 1.1%).
| Demographics | Rating | Rank | Male Poverty |
| Immigrants | St. Vincent and the Grenadines | 0.0 /100 | #288 | Tragic 13.8% |
| Guatemalans | 0.0 /100 | #289 | Tragic 13.8% |
| Immigrants | Zaire | 0.0 /100 | #290 | Tragic 13.8% |
| Vietnamese | 0.0 /100 | #291 | Tragic 13.8% |
| Indonesians | 0.0 /100 | #292 | Tragic 13.8% |
| Immigrants | Belize | 0.0 /100 | #293 | Tragic 13.8% |
| Hispanics or Latinos | 0.0 /100 | #294 | Tragic 13.9% |
| Immigrants | Central America | 0.0 /100 | #295 | Tragic 13.9% |
| Cajuns | 0.0 /100 | #296 | Tragic 13.9% |
| Inupiat | 0.0 /100 | #297 | Tragic 14.0% |
| Blackfeet | 0.0 /100 | #298 | Tragic 14.0% |
| Immigrants | Guatemala | 0.0 /100 | #299 | Tragic 14.0% |
| Immigrants | Mexico | 0.0 /100 | #300 | Tragic 14.0% |
| Immigrants | Senegal | 0.0 /100 | #301 | Tragic 14.0% |
| Immigrants | Caribbean | 0.0 /100 | #302 | Tragic 14.0% |
| Bahamians | 0.0 /100 | #303 | Tragic 14.1% |
| Senegalese | 0.0 /100 | #304 | Tragic 14.1% |
| Immigrants | Bangladesh | 0.0 /100 | #305 | Tragic 14.1% |
| Creek | 0.0 /100 | #306 | Tragic 14.1% |
| Dutch West Indians | 0.0 /100 | #307 | Tragic 14.2% |
| Africans | 0.0 /100 | #308 | Tragic 14.2% |