Guamanian/Chamorro vs Immigrants from Laos Seniors Poverty Over the Age of 65

COMPARE

Guamanian/Chamorro
Race
Ancestry
AfghanAfricanAlaska NativeAlaskan AthabascanAlbanianAleutAlsatianAmericanApacheArabArapahoArgentineanArmenianAssyrian/Chaldean/SyriacAustralianAustrianBahamianBangladeshiBarbadianBasqueBelgianBelizeanBermudanBhutaneseBlackfeetBolivianBrazilianBritishBritish West IndianBulgarianBurmeseCajunCambodianCanadianCape VerdeanCarpatho RusynCelticCentral AmericanCentral American IndianCherokeeCheyenneChickasawChileanChineseChippewaChoctawColombianColvilleComancheCosta RicanCreeCreekCroatianCrowCubanCypriotCzechCzechoslovakianDanishDelawareDominicanDutchDutch West IndianEastern EuropeanEcuadorianEgyptianEnglishEstonianEthiopianEuropeanFijianFilipinoFinnishFrenchFrench American IndianFrench CanadianGermanGerman RussianGhanaianGreekGuamanian/ChamorroGuatemalanGuyaneseHaitianHmongHonduranHopiHoumaHungarianIcelanderIndian (Asian)IndonesianInupiatIranianIraqiIrishIroquoisIsraeliItalianJamaicanJapaneseJordanianKenyanKiowaKoreanLaotianLatvianLebaneseLiberianLithuanianLumbeeLuxembourgerMacedonianMalaysianMalteseMarshalleseMenomineeMexicanMexican American IndianMongolianMoroccanNative HawaiianNavajoNepaleseNew ZealanderNicaraguanNigerianNorthern EuropeanNorwegianOkinawanOsageOttawaPaiutePakistaniPalestinianPanamanianParaguayanPennsylvania GermanPeruvianPimaPolishPortuguesePotawatomiPuebloPuerto RicanPuget Sound SalishRomanianRussianSalvadoranSamoanScandinavianScotch-IrishScottishSeminoleSenegaleseSerbianShoshoneSierra LeoneanSiouxSlavicSlovakSloveneSomaliSouth AfricanSouth AmericanSouth American IndianSoviet UnionSpaniardSpanishSpanish AmericanSpanish American IndianSri LankanSubsaharan AfricanSudaneseSwedishSwissSyrianTaiwaneseThaiTlingit-HaidaTohono O'OdhamTonganTrinidadian and TobagonianTsimshianTurkishU.S. Virgin IslanderUgandanUkrainianUruguayanUteVenezuelanVietnameseWelshWest IndianYakamaYaquiYugoslavianYumanYup'ikZimbabwean
Immigration
NonimmigrantsImmigrantsAfghanistanAfricaAlbaniaArgentinaArmeniaAsiaAustraliaAustriaBahamasBangladeshBarbadosBelarusBelgiumBelizeBoliviaBosnia and HerzegovinaBrazilBulgariaBurma/MyanmarCabo VerdeCambodiaCameroonCanadaCaribbeanCentral AmericaChileChinaColombiaCongoCosta RicaCroatiaCubaCzechoslovakiaDenmarkDominicaDominican RepublicEastern AfricaEastern AsiaEastern EuropeEcuadorEgyptEl SalvadorEnglandEritreaEthiopiaEuropeFijiFranceGermanyGhanaGreeceGrenadaGuatemalaGuyanaHaitiHondurasHong KongHungaryIndiaIndonesiaIranIraqIrelandIsraelItalyJamaicaJapanJordanKazakhstanKenyaKoreaKuwaitLatin AmericaLatviaLebanonLiberiaLithuaniaMalaysiaMexicoMicronesiaMiddle AfricaMoldovaMoroccoNepalNetherlandsNicaraguaNigeriaNorth AmericaNorth MacedoniaNorthern AfricaNorthern EuropeNorwayOceaniaPakistanPanamaPeruPhilippinesPolandPortugalRomaniaRussiaSaudi ArabiaScotlandSenegalSerbiaSierra LeoneSingaporeSomaliaSouth AfricaSouth AmericaSouth Central AsiaSouth Eastern AsiaSouthern EuropeSpainSri LankaSt. Vincent and the GrenadinesSudanSwedenSwitzerlandSyriaTaiwanThailandTrinidad and TobagoTurkeyUgandaUkraineUruguayUzbekistanVenezuelaVietnamWest IndiesWestern AfricaWestern AsiaWestern EuropeYemenZaireZimbabweAzores
Immigrants from Laos
Race
Ancestry
AfghanAfricanAlaska NativeAlaskan AthabascanAlbanianAleutAlsatianAmericanApacheArabArapahoArgentineanArmenianAssyrian/Chaldean/SyriacAustralianAustrianBahamianBangladeshiBarbadianBasqueBelgianBelizeanBermudanBhutaneseBlackfeetBolivianBrazilianBritishBritish West IndianBulgarianBurmeseCajunCambodianCanadianCape VerdeanCarpatho RusynCelticCentral AmericanCentral American IndianCherokeeCheyenneChickasawChileanChineseChippewaChoctawColombianColvilleComancheCosta RicanCreeCreekCroatianCrowCubanCypriotCzechCzechoslovakianDanishDelawareDominicanDutchDutch West IndianEastern EuropeanEcuadorianEgyptianEnglishEstonianEthiopianEuropeanFijianFilipinoFinnishFrenchFrench American IndianFrench CanadianGermanGerman RussianGhanaianGreekGuatemalanGuyaneseHaitianHmongHonduranHopiHoumaHungarianIcelanderIndian (Asian)IndonesianInupiatIranianIraqiIrishIroquoisIsraeliItalianJamaicanJapaneseJordanianKenyanKiowaKoreanLaotianLatvianLebaneseLiberianLithuanianLumbeeLuxembourgerMacedonianMalaysianMalteseMarshalleseMenomineeMexicanMexican American IndianMongolianMoroccanNative HawaiianNavajoNepaleseNew ZealanderNicaraguanNigerianNorthern EuropeanNorwegianOkinawanOsageOttawaPaiutePakistaniPalestinianPanamanianParaguayanPennsylvania GermanPeruvianPimaPolishPortuguesePotawatomiPuebloPuerto RicanPuget Sound SalishRomanianRussianSalvadoranSamoanScandinavianScotch-IrishScottishSeminoleSenegaleseSerbianShoshoneSierra LeoneanSiouxSlavicSlovakSloveneSomaliSouth AfricanSouth AmericanSouth American IndianSoviet UnionSpaniardSpanishSpanish AmericanSpanish American IndianSri LankanSubsaharan AfricanSudaneseSwedishSwissSyrianTaiwaneseThaiTlingit-HaidaTohono O'OdhamTonganTrinidadian and TobagonianTsimshianTurkishU.S. Virgin IslanderUgandanUkrainianUruguayanUteVenezuelanVietnameseWelshWest IndianYakamaYaquiYugoslavianYumanYup'ikZimbabwean
Immigration
NonimmigrantsImmigrantsAfghanistanAfricaAlbaniaArgentinaArmeniaAsiaAustraliaAustriaBahamasBangladeshBarbadosBelarusBelgiumBelizeBoliviaBosnia and HerzegovinaBrazilBulgariaBurma/MyanmarCabo VerdeCambodiaCameroonCanadaCaribbeanCentral AmericaChileChinaColombiaCongoCosta RicaCroatiaCubaCzechoslovakiaDenmarkDominicaDominican RepublicEastern AfricaEastern AsiaEastern EuropeEcuadorEgyptEl SalvadorEnglandEritreaEthiopiaEuropeFijiFranceGermanyGhanaGreeceGrenadaGuatemalaGuyanaHaitiHondurasHong KongHungaryIndiaIndonesiaIranIraqIrelandIsraelItalyJamaicaJapanJordanKazakhstanKenyaKoreaKuwaitLaosLatin AmericaLatviaLebanonLiberiaLithuaniaMalaysiaMexicoMicronesiaMiddle AfricaMoldovaMoroccoNepalNetherlandsNicaraguaNigeriaNorth AmericaNorth MacedoniaNorthern AfricaNorthern EuropeNorwayOceaniaPakistanPanamaPeruPhilippinesPolandPortugalRomaniaRussiaSaudi ArabiaScotlandSenegalSerbiaSierra LeoneSingaporeSomaliaSouth AfricaSouth AmericaSouth Central AsiaSouth Eastern AsiaSouthern EuropeSpainSri LankaSt. Vincent and the GrenadinesSudanSwedenSwitzerlandSyriaTaiwanThailandTrinidad and TobagoTurkeyUgandaUkraineUruguayUzbekistanVenezuelaVietnamWest IndiesWestern AfricaWestern AsiaWestern EuropeYemenZaireZimbabweAzores
Seniors Poverty Over the Age of 65
Income
Poverty
Unemployment
Labor Participation
Family Structure
Vehicle Availability
Education Level
Disability

Seniors Poverty Over the Age of 65 Comparison

Guamanians/Chamorros

Immigrants from Laos

Excellent
Fair
10.5%
SENIORS POVERTY OVER THE AGE OF 65
87.5/ 100
METRIC RATING
133rd/ 347
METRIC RANK
11.1%
SENIORS POVERTY OVER THE AGE OF 65
35.7/ 100
METRIC RATING
189th/ 347
METRIC RANK

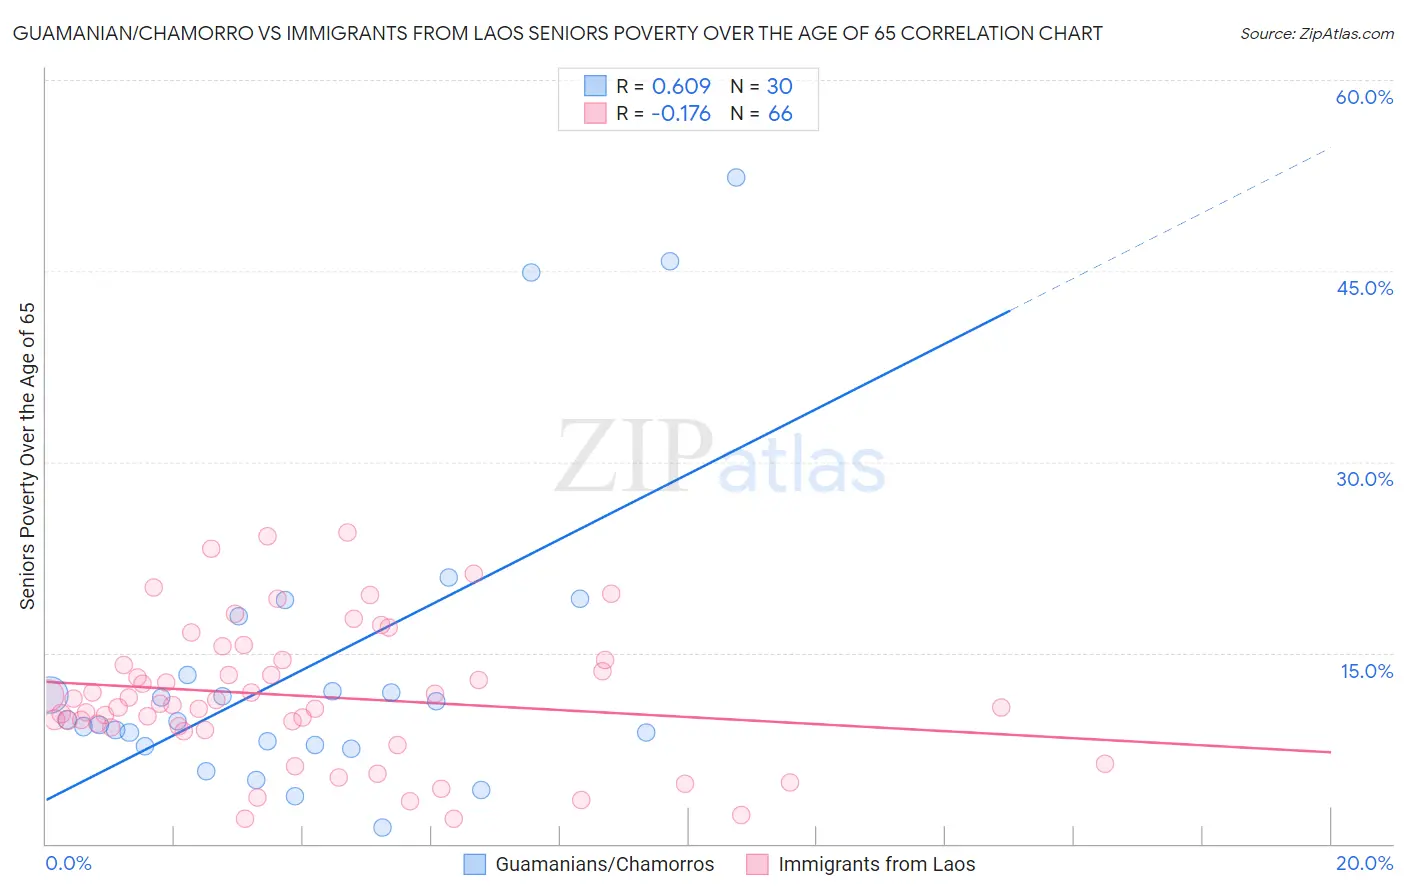
Guamanian/Chamorro vs Immigrants from Laos Seniors Poverty Over the Age of 65 Correlation Chart

The statistical analysis conducted on geographies consisting of 221,115,754 people shows a significant positive correlation between the proportion of Guamanians/Chamorros and poverty level among seniors over the age of 65 in the United States with a correlation coefficient (R) of 0.609 and weighted average of 10.5%. Similarly, the statistical analysis conducted on geographies consisting of 201,308,841 people shows a poor negative correlation between the proportion of Immigrants from Laos and poverty level among seniors over the age of 65 in the United States with a correlation coefficient (R) of -0.176 and weighted average of 11.1%, a difference of 5.9%.
Guamanian/Chamorro vs Immigrants from Laos Seniors Poverty Over the Age of 65

Seniors Poverty Over the Age of 65 Correlation Summary

MeasurementGuamanian/ChamorroImmigrants from Laos
Minimum1.2%2.0%
Maximum52.4%24.5%
Range51.1%22.5%
Mean13.9%11.6%
Median9.7%10.9%
Interquartile 25% (IQ1)7.7%9.1%
Interquartile 75% (IQ3)13.2%14.4%
Interquartile Range (IQR)5.5%5.3%
Standard Deviation (Sample)12.3%5.4%
Standard Deviation (Population)12.1%5.3%

Similar Demographics by Seniors Poverty Over the Age of 65

Demographics Similar to Guamanians/Chamorros by Seniors Poverty Over the Age of 65

In terms of seniors poverty over the age of 65, the demographic groups most similar to Guamanians/Chamorros are Immigrants from Turkey (10.5%, a difference of 0.040%), Egyptian (10.5%, a difference of 0.050%), Sierra Leonean (10.5%, a difference of 0.15%), Immigrants from Iran (10.4%, a difference of 0.20%), and Immigrants from Oceania (10.4%, a difference of 0.20%).
DemographicsRating | RankSeniors Poverty Over the Age of 65
Immigrants | Hungary
89.1
/100
|
#126
Excellent
10.4%
Cambodians
89.1
/100
|
#127
Excellent
10.4%
Ottawa
88.5
/100
|
#128
Excellent
10.4%
Immigrants | Iran
88.4
/100
|
#129
Excellent
10.4%
Immigrants | Oceania
88.4
/100
|
#130
Excellent
10.4%
Egyptians
87.8
/100
|
#131
Excellent
10.5%
Immigrants | Turkey
87.7
/100
|
#132
Excellent
10.5%
Guamanians/Chamorros
87.5
/100
|
#133
Excellent
10.5%
Sierra Leoneans
86.8
/100
|
#134
Excellent
10.5%
Immigrants | Norway
86.5
/100
|
#135
Excellent
10.5%
Immigrants | Serbia
86.4
/100
|
#136
Excellent
10.5%
Immigrants | Australia
85.1
/100
|
#137
Excellent
10.5%
Immigrants | Latvia
84.7
/100
|
#138
Excellent
10.5%
Portuguese
84.1
/100
|
#139
Excellent
10.5%
Immigrants | Kenya
83.4
/100
|
#140
Excellent
10.5%

Demographics Similar to Immigrants from Laos by Seniors Poverty Over the Age of 65

In terms of seniors poverty over the age of 65, the demographic groups most similar to Immigrants from Laos are Immigrants from Hong Kong (11.1%, a difference of 0.060%), Indian (Asian) (11.1%, a difference of 0.15%), Immigrants from Middle Africa (11.1%, a difference of 0.16%), Immigrants from Eastern Asia (11.1%, a difference of 0.17%), and Immigrants from Lebanon (11.1%, a difference of 0.23%).
DemographicsRating | RankSeniors Poverty Over the Age of 65
Immigrants | Fiji
42.0
/100
|
#182
Average
11.0%
Immigrants | Kazakhstan
41.0
/100
|
#183
Average
11.0%
Immigrants | France
40.9
/100
|
#184
Average
11.0%
Immigrants | Lebanon
38.2
/100
|
#185
Fair
11.1%
Immigrants | Eastern Asia
37.5
/100
|
#186
Fair
11.1%
Immigrants | Middle Africa
37.4
/100
|
#187
Fair
11.1%
Immigrants | Hong Kong
36.3
/100
|
#188
Fair
11.1%
Immigrants | Laos
35.7
/100
|
#189
Fair
11.1%
Indians (Asian)
34.2
/100
|
#190
Fair
11.1%
Immigrants | Uganda
32.2
/100
|
#191
Fair
11.1%
Immigrants | Southern Europe
30.1
/100
|
#192
Fair
11.1%
Taiwanese
29.2
/100
|
#193
Fair
11.2%
Chileans
27.8
/100
|
#194
Fair
11.2%
Immigrants | Vietnam
26.6
/100
|
#195
Fair
11.2%
Bangladeshis
25.2
/100
|
#196
Fair
11.2%