Guamanian/Chamorro vs Immigrants from Laos 2 or more Vehicles in Household
COMPARE
Guamanian/Chamorro
Immigrants from Laos
2 or more Vehicles in Household
2 or more Vehicles in Household Comparison
Guamanians/Chamorros
Immigrants from Laos
60.5%
2 OR MORE VEHICLES IN HOUSEHOLD
100.0/ 100
METRIC RATING
28th/ 347
METRIC RANK
59.2%
2 OR MORE VEHICLES IN HOUSEHOLD
99.9/ 100
METRIC RATING
52nd/ 347
METRIC RANK
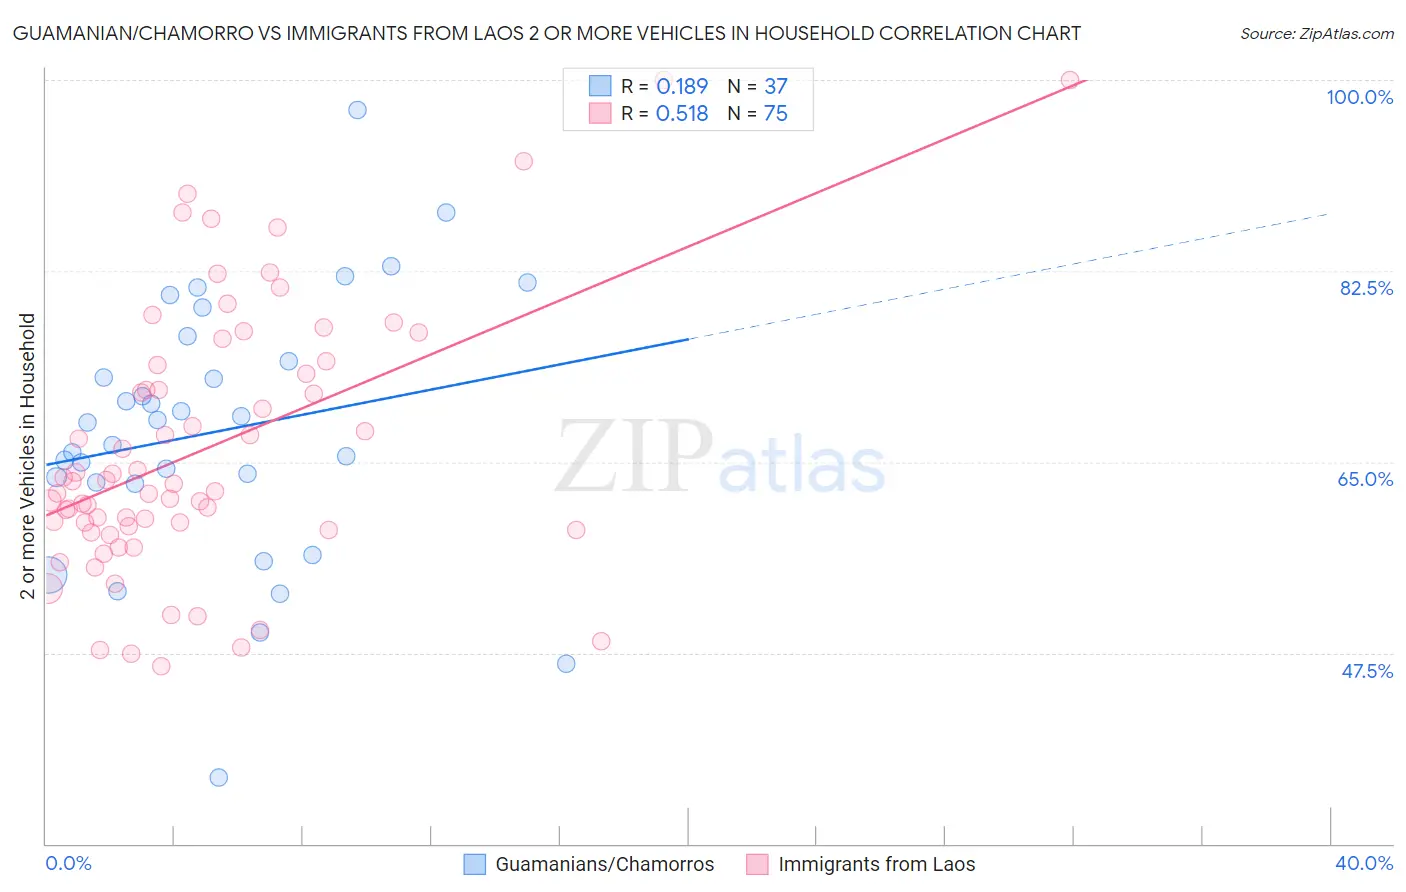
Guamanian/Chamorro vs Immigrants from Laos 2 or more Vehicles in Household Correlation Chart
The statistical analysis conducted on geographies consisting of 221,880,536 people shows a poor positive correlation between the proportion of Guamanians/Chamorros and percentage of households with 2 or more vehicles available in the United States with a correlation coefficient (R) of 0.189 and weighted average of 60.5%. Similarly, the statistical analysis conducted on geographies consisting of 201,468,892 people shows a substantial positive correlation between the proportion of Immigrants from Laos and percentage of households with 2 or more vehicles available in the United States with a correlation coefficient (R) of 0.518 and weighted average of 59.2%, a difference of 2.2%.
2 or more Vehicles in Household Correlation Summary
| Measurement | Guamanian/Chamorro | Immigrants from Laos |
| Minimum | 36.1% | 46.3% |
| Maximum | 97.2% | 100.0% |
| Range | 61.2% | 53.7% |
| Mean | 67.8% | 66.2% |
| Median | 68.6% | 63.0% |
| Interquartile 25% (IQ1) | 63.0% | 58.8% |
| Interquartile 75% (IQ3) | 75.3% | 73.9% |
| Interquartile Range (IQR) | 12.3% | 15.1% |
| Standard Deviation (Sample) | 12.2% | 12.2% |
| Standard Deviation (Population) | 12.0% | 12.1% |
Similar Demographics by 2 or more Vehicles in Household
Demographics Similar to Guamanians/Chamorros by 2 or more Vehicles in Household
In terms of 2 or more vehicles in household, the demographic groups most similar to Guamanians/Chamorros are Hawaiian (60.4%, a difference of 0.11%), Assyrian/Chaldean/Syriac (60.5%, a difference of 0.13%), Finnish (60.3%, a difference of 0.24%), Spanish American Indian (60.3%, a difference of 0.26%), and Arapaho (60.2%, a difference of 0.37%).
| Demographics | Rating | Rank | 2 or more Vehicles in Household |
| Koreans | 100.0 /100 | #21 | Exceptional 61.0% |
| Swiss | 100.0 /100 | #22 | Exceptional 61.0% |
| Scotch-Irish | 100.0 /100 | #23 | Exceptional 60.9% |
| Immigrants | Vietnam | 100.0 /100 | #24 | Exceptional 60.9% |
| Whites/Caucasians | 100.0 /100 | #25 | Exceptional 60.8% |
| Welsh | 100.0 /100 | #26 | Exceptional 60.8% |
| Assyrians/Chaldeans/Syriacs | 100.0 /100 | #27 | Exceptional 60.5% |
| Guamanians/Chamorros | 100.0 /100 | #28 | Exceptional 60.5% |
| Hawaiians | 100.0 /100 | #29 | Exceptional 60.4% |
| Finns | 100.0 /100 | #30 | Exceptional 60.3% |
| Spanish American Indians | 100.0 /100 | #31 | Exceptional 60.3% |
| Arapaho | 100.0 /100 | #32 | Exceptional 60.2% |
| Immigrants | Mexico | 100.0 /100 | #33 | Exceptional 60.2% |
| Spanish | 100.0 /100 | #34 | Exceptional 60.2% |
| Immigrants | Philippines | 100.0 /100 | #35 | Exceptional 60.1% |
Demographics Similar to Immigrants from Laos by 2 or more Vehicles in Household
In terms of 2 or more vehicles in household, the demographic groups most similar to Immigrants from Laos are Spaniard (59.2%, a difference of 0.0%), Celtic (59.2%, a difference of 0.010%), Choctaw (59.3%, a difference of 0.14%), Belgian (59.3%, a difference of 0.15%), and Bhutanese (59.1%, a difference of 0.16%).
| Demographics | Rating | Rank | 2 or more Vehicles in Household |
| Immigrants | Taiwan | 100.0 /100 | #45 | Exceptional 59.7% |
| Immigrants | South Eastern Asia | 100.0 /100 | #46 | Exceptional 59.6% |
| Yaqui | 99.9 /100 | #47 | Exceptional 59.3% |
| Immigrants | India | 99.9 /100 | #48 | Exceptional 59.3% |
| Belgians | 99.9 /100 | #49 | Exceptional 59.3% |
| Choctaw | 99.9 /100 | #50 | Exceptional 59.3% |
| Spaniards | 99.9 /100 | #51 | Exceptional 59.2% |
| Immigrants | Laos | 99.9 /100 | #52 | Exceptional 59.2% |
| Celtics | 99.9 /100 | #53 | Exceptional 59.2% |
| Bhutanese | 99.9 /100 | #54 | Exceptional 59.1% |
| Luxembourgers | 99.9 /100 | #55 | Exceptional 59.1% |
| Chickasaw | 99.9 /100 | #56 | Exceptional 59.0% |
| Afghans | 99.9 /100 | #57 | Exceptional 59.0% |
| Immigrants | Scotland | 99.8 /100 | #58 | Exceptional 58.9% |
| Spanish Americans | 99.8 /100 | #59 | Exceptional 58.9% |