Guamanian/Chamorro vs Native Hawaiian Seniors Poverty Over the Age of 65

COMPARE

Guamanian/Chamorro
Race
Ancestry
AfghanAfricanAlaska NativeAlaskan AthabascanAlbanianAleutAlsatianAmericanApacheArabArapahoArgentineanArmenianAssyrian/Chaldean/SyriacAustralianAustrianBahamianBangladeshiBarbadianBasqueBelgianBelizeanBermudanBhutaneseBlackfeetBolivianBrazilianBritishBritish West IndianBulgarianBurmeseCajunCambodianCanadianCape VerdeanCarpatho RusynCelticCentral AmericanCentral American IndianCherokeeCheyenneChickasawChileanChineseChippewaChoctawColombianColvilleComancheCosta RicanCreeCreekCroatianCrowCubanCypriotCzechCzechoslovakianDanishDelawareDominicanDutchDutch West IndianEastern EuropeanEcuadorianEgyptianEnglishEstonianEthiopianEuropeanFijianFilipinoFinnishFrenchFrench American IndianFrench CanadianGermanGerman RussianGhanaianGreekGuamanian/ChamorroGuatemalanGuyaneseHaitianHmongHonduranHopiHoumaHungarianIcelanderIndian (Asian)IndonesianInupiatIranianIraqiIrishIroquoisIsraeliItalianJamaicanJapaneseJordanianKenyanKiowaKoreanLaotianLatvianLebaneseLiberianLithuanianLumbeeLuxembourgerMacedonianMalaysianMalteseMarshalleseMenomineeMexicanMexican American IndianMongolianMoroccanNavajoNepaleseNew ZealanderNicaraguanNigerianNorthern EuropeanNorwegianOkinawanOsageOttawaPaiutePakistaniPalestinianPanamanianParaguayanPennsylvania GermanPeruvianPimaPolishPortuguesePotawatomiPuebloPuerto RicanPuget Sound SalishRomanianRussianSalvadoranSamoanScandinavianScotch-IrishScottishSeminoleSenegaleseSerbianShoshoneSierra LeoneanSiouxSlavicSlovakSloveneSomaliSouth AfricanSouth AmericanSouth American IndianSoviet UnionSpaniardSpanishSpanish AmericanSpanish American IndianSri LankanSubsaharan AfricanSudaneseSwedishSwissSyrianTaiwaneseThaiTlingit-HaidaTohono O'OdhamTonganTrinidadian and TobagonianTsimshianTurkishU.S. Virgin IslanderUgandanUkrainianUruguayanUteVenezuelanVietnameseWelshWest IndianYakamaYaquiYugoslavianYumanYup'ikZimbabwean
Immigration
NonimmigrantsImmigrantsAfghanistanAfricaAlbaniaArgentinaArmeniaAsiaAustraliaAustriaBahamasBangladeshBarbadosBelarusBelgiumBelizeBoliviaBosnia and HerzegovinaBrazilBulgariaBurma/MyanmarCabo VerdeCambodiaCameroonCanadaCaribbeanCentral AmericaChileChinaColombiaCongoCosta RicaCroatiaCubaCzechoslovakiaDenmarkDominicaDominican RepublicEastern AfricaEastern AsiaEastern EuropeEcuadorEgyptEl SalvadorEnglandEritreaEthiopiaEuropeFijiFranceGermanyGhanaGreeceGrenadaGuatemalaGuyanaHaitiHondurasHong KongHungaryIndiaIndonesiaIranIraqIrelandIsraelItalyJamaicaJapanJordanKazakhstanKenyaKoreaKuwaitLaosLatin AmericaLatviaLebanonLiberiaLithuaniaMalaysiaMexicoMicronesiaMiddle AfricaMoldovaMoroccoNepalNetherlandsNicaraguaNigeriaNorth AmericaNorth MacedoniaNorthern AfricaNorthern EuropeNorwayOceaniaPakistanPanamaPeruPhilippinesPolandPortugalRomaniaRussiaSaudi ArabiaScotlandSenegalSerbiaSierra LeoneSingaporeSomaliaSouth AfricaSouth AmericaSouth Central AsiaSouth Eastern AsiaSouthern EuropeSpainSri LankaSt. Vincent and the GrenadinesSudanSwedenSwitzerlandSyriaTaiwanThailandTrinidad and TobagoTurkeyUgandaUkraineUruguayUzbekistanVenezuelaVietnamWest IndiesWestern AfricaWestern AsiaWestern EuropeYemenZaireZimbabweAzores
Native Hawaiian
Race
Ancestry
AfghanAfricanAlaska NativeAlaskan AthabascanAlbanianAleutAlsatianAmericanApacheArabArapahoArgentineanArmenianAssyrian/Chaldean/SyriacAustralianAustrianBahamianBangladeshiBarbadianBasqueBelgianBelizeanBermudanBhutaneseBlackfeetBolivianBrazilianBritishBritish West IndianBulgarianBurmeseCajunCambodianCanadianCape VerdeanCarpatho RusynCelticCentral AmericanCentral American IndianCherokeeCheyenneChickasawChileanChineseChippewaChoctawColombianColvilleComancheCosta RicanCreeCreekCroatianCrowCubanCypriotCzechCzechoslovakianDanishDelawareDominicanDutchDutch West IndianEastern EuropeanEcuadorianEgyptianEnglishEstonianEthiopianEuropeanFijianFilipinoFinnishFrenchFrench American IndianFrench CanadianGermanGerman RussianGhanaianGreekGuatemalanGuyaneseHaitianHmongHonduranHopiHoumaHungarianIcelanderIndian (Asian)IndonesianInupiatIranianIraqiIrishIroquoisIsraeliItalianJamaicanJapaneseJordanianKenyanKiowaKoreanLaotianLatvianLebaneseLiberianLithuanianLumbeeLuxembourgerMacedonianMalaysianMalteseMarshalleseMenomineeMexicanMexican American IndianMongolianMoroccanNative HawaiianNavajoNepaleseNew ZealanderNicaraguanNigerianNorthern EuropeanNorwegianOkinawanOsageOttawaPaiutePakistaniPalestinianPanamanianParaguayanPennsylvania GermanPeruvianPimaPolishPortuguesePotawatomiPuebloPuerto RicanPuget Sound SalishRomanianRussianSalvadoranSamoanScandinavianScotch-IrishScottishSeminoleSenegaleseSerbianShoshoneSierra LeoneanSiouxSlavicSlovakSloveneSomaliSouth AfricanSouth AmericanSouth American IndianSoviet UnionSpaniardSpanishSpanish AmericanSpanish American IndianSri LankanSubsaharan AfricanSudaneseSwedishSwissSyrianTaiwaneseThaiTlingit-HaidaTohono O'OdhamTonganTrinidadian and TobagonianTsimshianTurkishU.S. Virgin IslanderUgandanUkrainianUruguayanUteVenezuelanVietnameseWelshWest IndianYakamaYaquiYugoslavianYumanYup'ikZimbabwean
Immigration
NonimmigrantsImmigrantsAfghanistanAfricaAlbaniaArgentinaArmeniaAsiaAustraliaAustriaBahamasBangladeshBarbadosBelarusBelgiumBelizeBoliviaBosnia and HerzegovinaBrazilBulgariaBurma/MyanmarCabo VerdeCambodiaCameroonCanadaCaribbeanCentral AmericaChileChinaColombiaCongoCosta RicaCroatiaCubaCzechoslovakiaDenmarkDominicaDominican RepublicEastern AfricaEastern AsiaEastern EuropeEcuadorEgyptEl SalvadorEnglandEritreaEthiopiaEuropeFijiFranceGermanyGhanaGreeceGrenadaGuatemalaGuyanaHaitiHondurasHong KongHungaryIndiaIndonesiaIranIraqIrelandIsraelItalyJamaicaJapanJordanKazakhstanKenyaKoreaKuwaitLaosLatin AmericaLatviaLebanonLiberiaLithuaniaMalaysiaMexicoMicronesiaMiddle AfricaMoldovaMoroccoNepalNetherlandsNicaraguaNigeriaNorth AmericaNorth MacedoniaNorthern AfricaNorthern EuropeNorwayOceaniaPakistanPanamaPeruPhilippinesPolandPortugalRomaniaRussiaSaudi ArabiaScotlandSenegalSerbiaSierra LeoneSingaporeSomaliaSouth AfricaSouth AmericaSouth Central AsiaSouth Eastern AsiaSouthern EuropeSpainSri LankaSt. Vincent and the GrenadinesSudanSwedenSwitzerlandSyriaTaiwanThailandTrinidad and TobagoTurkeyUgandaUkraineUruguayUzbekistanVenezuelaVietnamWest IndiesWestern AfricaWestern AsiaWestern EuropeYemenZaireZimbabweAzores
Seniors Poverty Over the Age of 65
Income
Poverty
Unemployment
Labor Participation
Family Structure
Vehicle Availability
Education Level
Disability

Seniors Poverty Over the Age of 65 Comparison

Guamanians/Chamorros

Native Hawaiians

Excellent
Exceptional
10.5%
SENIORS POVERTY OVER THE AGE OF 65
87.5/ 100
METRIC RATING
133rd/ 347
METRIC RANK
9.4%
SENIORS POVERTY OVER THE AGE OF 65
99.8/ 100
METRIC RATING
33rd/ 347
METRIC RANK

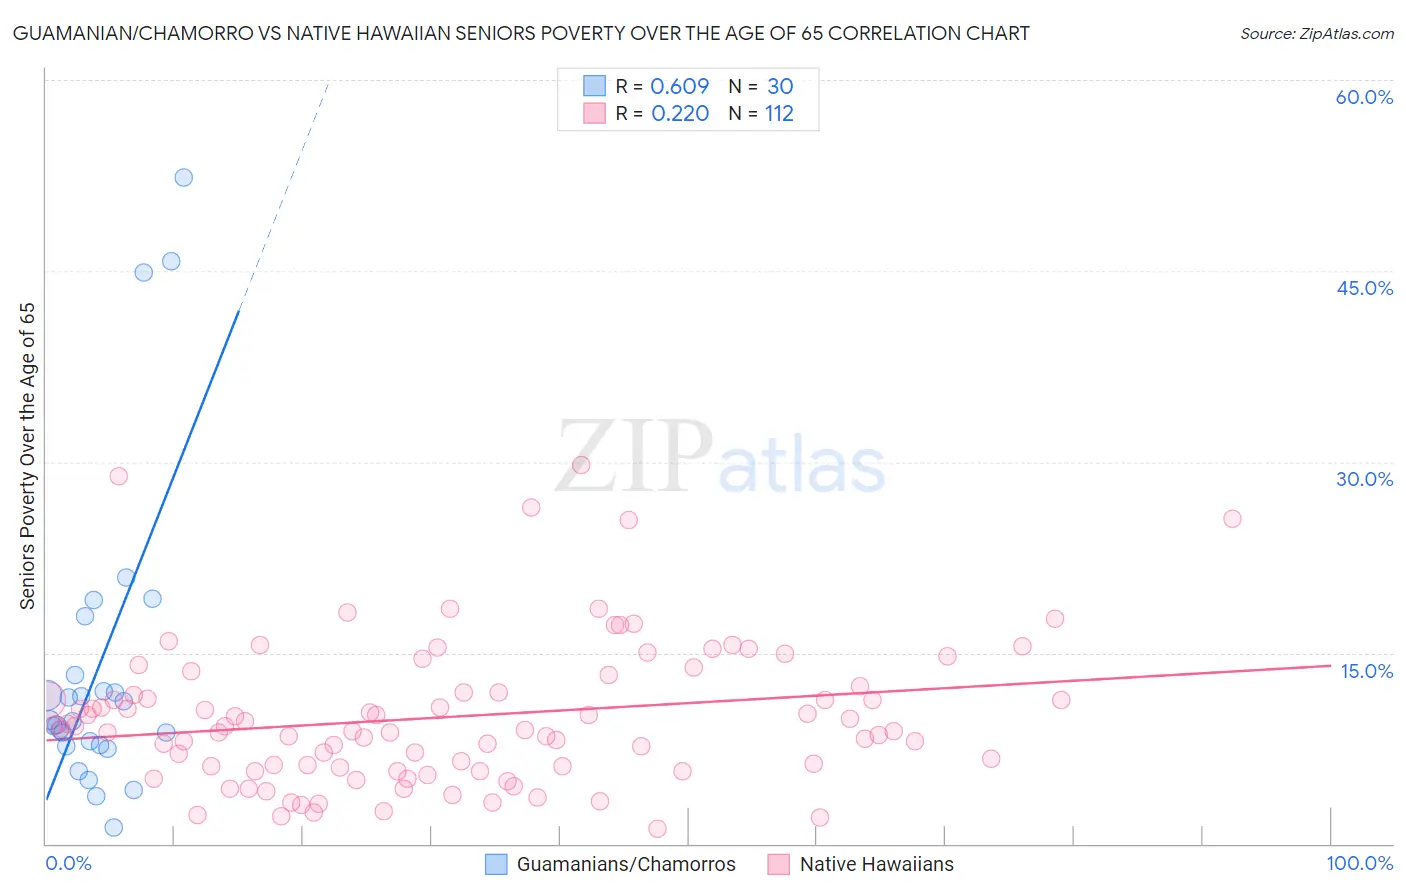
Guamanian/Chamorro vs Native Hawaiian Seniors Poverty Over the Age of 65 Correlation Chart

The statistical analysis conducted on geographies consisting of 221,115,754 people shows a significant positive correlation between the proportion of Guamanians/Chamorros and poverty level among seniors over the age of 65 in the United States with a correlation coefficient (R) of 0.609 and weighted average of 10.5%. Similarly, the statistical analysis conducted on geographies consisting of 330,714,575 people shows a weak positive correlation between the proportion of Native Hawaiians and poverty level among seniors over the age of 65 in the United States with a correlation coefficient (R) of 0.220 and weighted average of 9.4%, a difference of 11.2%.
Guamanian/Chamorro vs Native Hawaiian Seniors Poverty Over the Age of 65

Seniors Poverty Over the Age of 65 Correlation Summary

MeasurementGuamanian/ChamorroNative Hawaiian
Minimum1.2%1.2%
Maximum52.4%29.8%
Range51.1%28.6%
Mean13.9%10.0%
Median9.7%9.0%
Interquartile 25% (IQ1)7.7%6.0%
Interquartile 75% (IQ3)13.2%12.2%
Interquartile Range (IQR)5.5%6.1%
Standard Deviation (Sample)12.3%5.7%
Standard Deviation (Population)12.1%5.6%

Similar Demographics by Seniors Poverty Over the Age of 65

Demographics Similar to Guamanians/Chamorros by Seniors Poverty Over the Age of 65

In terms of seniors poverty over the age of 65, the demographic groups most similar to Guamanians/Chamorros are Immigrants from Turkey (10.5%, a difference of 0.040%), Egyptian (10.5%, a difference of 0.050%), Sierra Leonean (10.5%, a difference of 0.15%), Immigrants from Iran (10.4%, a difference of 0.20%), and Immigrants from Oceania (10.4%, a difference of 0.20%).
DemographicsRating | RankSeniors Poverty Over the Age of 65
Immigrants | Hungary
89.1
/100
|
#126
Excellent
10.4%
Cambodians
89.1
/100
|
#127
Excellent
10.4%
Ottawa
88.5
/100
|
#128
Excellent
10.4%
Immigrants | Iran
88.4
/100
|
#129
Excellent
10.4%
Immigrants | Oceania
88.4
/100
|
#130
Excellent
10.4%
Egyptians
87.8
/100
|
#131
Excellent
10.5%
Immigrants | Turkey
87.7
/100
|
#132
Excellent
10.5%
Guamanians/Chamorros
87.5
/100
|
#133
Excellent
10.5%
Sierra Leoneans
86.8
/100
|
#134
Excellent
10.5%
Immigrants | Norway
86.5
/100
|
#135
Excellent
10.5%
Immigrants | Serbia
86.4
/100
|
#136
Excellent
10.5%
Immigrants | Australia
85.1
/100
|
#137
Excellent
10.5%
Immigrants | Latvia
84.7
/100
|
#138
Excellent
10.5%
Portuguese
84.1
/100
|
#139
Excellent
10.5%
Immigrants | Kenya
83.4
/100
|
#140
Excellent
10.5%

Demographics Similar to Native Hawaiians by Seniors Poverty Over the Age of 65

In terms of seniors poverty over the age of 65, the demographic groups most similar to Native Hawaiians are Northern European (9.4%, a difference of 0.020%), British (9.4%, a difference of 0.10%), Finnish (9.4%, a difference of 0.30%), Latvian (9.5%, a difference of 0.48%), and Menominee (9.4%, a difference of 0.52%).
DemographicsRating | RankSeniors Poverty Over the Age of 65
Immigrants | Scotland
99.9
/100
|
#26
Exceptional
9.3%
Italians
99.9
/100
|
#27
Exceptional
9.3%
Tongans
99.9
/100
|
#28
Exceptional
9.3%
Bhutanese
99.9
/100
|
#29
Exceptional
9.3%
Menominee
99.8
/100
|
#30
Exceptional
9.4%
Finns
99.8
/100
|
#31
Exceptional
9.4%
Northern Europeans
99.8
/100
|
#32
Exceptional
9.4%
Native Hawaiians
99.8
/100
|
#33
Exceptional
9.4%
British
99.8
/100
|
#34
Exceptional
9.4%
Latvians
99.8
/100
|
#35
Exceptional
9.5%
Czechoslovakians
99.8
/100
|
#36
Exceptional
9.5%
Scotch-Irish
99.7
/100
|
#37
Exceptional
9.5%
Belgians
99.7
/100
|
#38
Exceptional
9.5%
Greeks
99.6
/100
|
#39
Exceptional
9.6%
Assyrians/Chaldeans/Syriacs
99.6
/100
|
#40
Exceptional
9.6%