Paraguayan vs Immigrants from Laos Seniors Poverty Over the Age of 65
COMPARE
Paraguayan
Immigrants from Laos
Seniors Poverty Over the Age of 65
Seniors Poverty Over the Age of 65 Comparison
Paraguayans
Immigrants from Laos
11.4%
SENIORS POVERTY OVER THE AGE OF 65
11.3/ 100
METRIC RATING
209th/ 347
METRIC RANK
11.1%
SENIORS POVERTY OVER THE AGE OF 65
35.7/ 100
METRIC RATING
189th/ 347
METRIC RANK
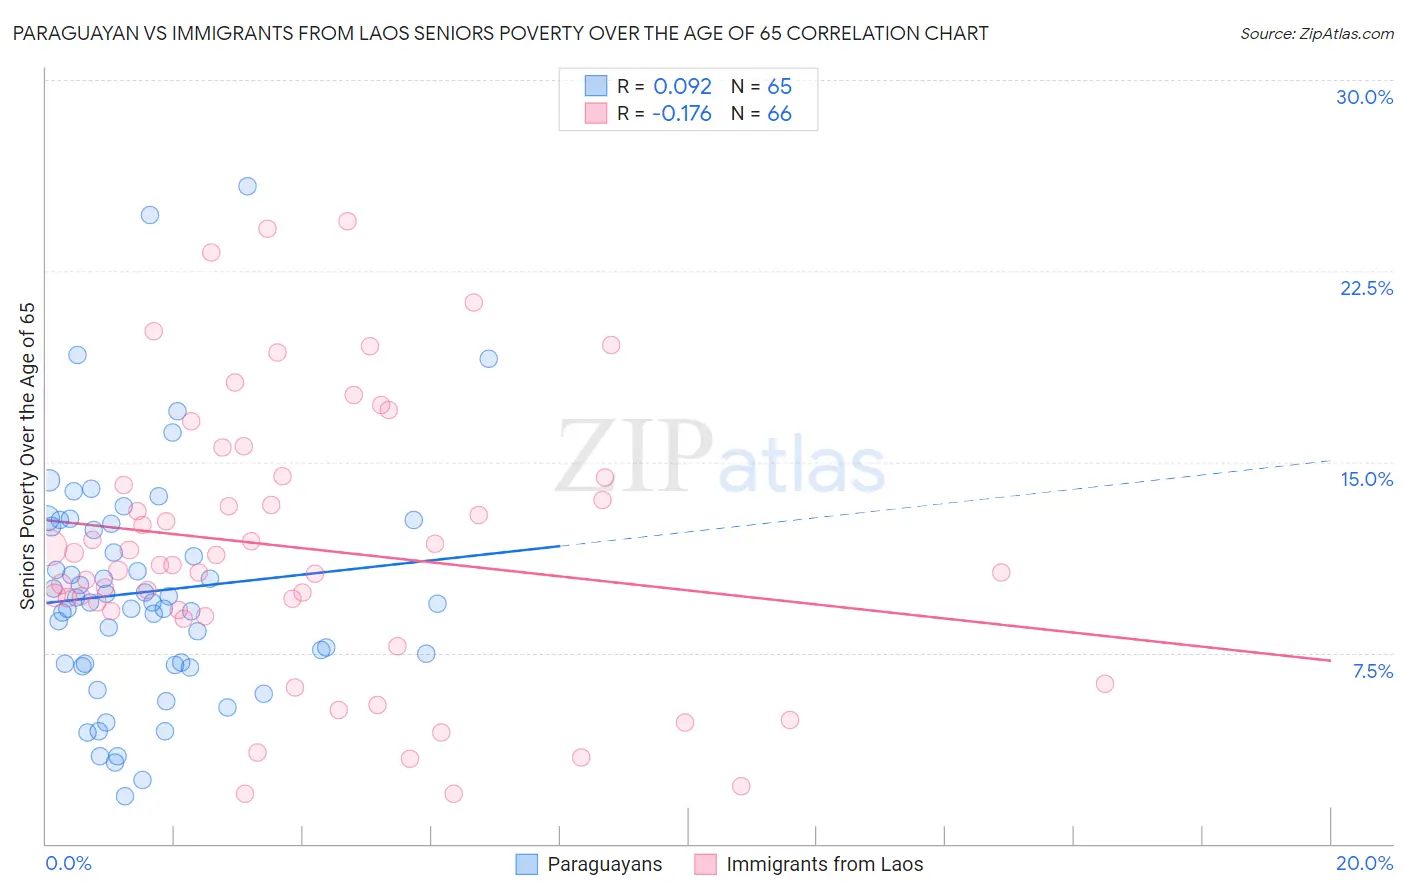
Paraguayan vs Immigrants from Laos Seniors Poverty Over the Age of 65 Correlation Chart
The statistical analysis conducted on geographies consisting of 95,049,863 people shows a slight positive correlation between the proportion of Paraguayans and poverty level among seniors over the age of 65 in the United States with a correlation coefficient (R) of 0.092 and weighted average of 11.4%. Similarly, the statistical analysis conducted on geographies consisting of 201,308,841 people shows a poor negative correlation between the proportion of Immigrants from Laos and poverty level among seniors over the age of 65 in the United States with a correlation coefficient (R) of -0.176 and weighted average of 11.1%, a difference of 3.2%.
Seniors Poverty Over the Age of 65 Correlation Summary
| Measurement | Paraguayan | Immigrants from Laos |
| Minimum | 1.8% | 2.0% |
| Maximum | 25.8% | 24.5% |
| Range | 24.0% | 22.5% |
| Mean | 9.9% | 11.6% |
| Median | 9.5% | 10.9% |
| Interquartile 25% (IQ1) | 7.1% | 9.1% |
| Interquartile 75% (IQ3) | 12.5% | 14.4% |
| Interquartile Range (IQR) | 5.5% | 5.3% |
| Standard Deviation (Sample) | 4.6% | 5.4% |
| Standard Deviation (Population) | 4.6% | 5.3% |
Demographics Similar to Paraguayans and Immigrants from Laos by Seniors Poverty Over the Age of 65
In terms of seniors poverty over the age of 65, the demographic groups most similar to Paraguayans are South American Indian (11.4%, a difference of 0.070%), Immigrants from Western Asia (11.4%, a difference of 0.44%), Choctaw (11.4%, a difference of 0.61%), Brazilian (11.3%, a difference of 0.75%), and Israeli (11.3%, a difference of 0.93%). Similarly, the demographic groups most similar to Immigrants from Laos are Indian (Asian) (11.1%, a difference of 0.15%), Immigrants from Uganda (11.1%, a difference of 0.34%), Immigrants from Southern Europe (11.1%, a difference of 0.56%), Taiwanese (11.2%, a difference of 0.65%), and Chilean (11.2%, a difference of 0.80%).
| Demographics | Rating | Rank | Seniors Poverty Over the Age of 65 |
| Immigrants | Laos | 35.7 /100 | #189 | Fair 11.1% |
| Indians (Asian) | 34.2 /100 | #190 | Fair 11.1% |
| Immigrants | Uganda | 32.2 /100 | #191 | Fair 11.1% |
| Immigrants | Southern Europe | 30.1 /100 | #192 | Fair 11.1% |
| Taiwanese | 29.2 /100 | #193 | Fair 11.2% |
| Chileans | 27.8 /100 | #194 | Fair 11.2% |
| Immigrants | Vietnam | 26.6 /100 | #195 | Fair 11.2% |
| Bangladeshis | 25.2 /100 | #196 | Fair 11.2% |
| Albanians | 24.4 /100 | #197 | Fair 11.2% |
| Immigrants | Burma/Myanmar | 21.3 /100 | #198 | Fair 11.3% |
| Immigrants | Israel | 20.3 /100 | #199 | Fair 11.3% |
| Alsatians | 20.1 /100 | #200 | Fair 11.3% |
| Immigrants | Brazil | 17.8 /100 | #201 | Poor 11.3% |
| Costa Ricans | 17.0 /100 | #202 | Poor 11.3% |
| Immigrants | Zaire | 16.9 /100 | #203 | Poor 11.3% |
| Israelis | 16.5 /100 | #204 | Poor 11.3% |
| Brazilians | 15.4 /100 | #205 | Poor 11.3% |
| Choctaw | 14.5 /100 | #206 | Poor 11.4% |
| Immigrants | Western Asia | 13.6 /100 | #207 | Poor 11.4% |
| South American Indians | 11.7 /100 | #208 | Poor 11.4% |
| Paraguayans | 11.3 /100 | #209 | Poor 11.4% |