Mexican American Indian vs Costa Rican Single Male Poverty
COMPARE
Mexican American Indian
Costa Rican
Single Male Poverty
Single Male Poverty Comparison
Mexican American Indians
Costa Ricans
13.1%
SINGLE MALE POVERTY
17.5/ 100
METRIC RATING
209th/ 347
METRIC RANK
12.8%
SINGLE MALE POVERTY
50.0/ 100
METRIC RATING
174th/ 347
METRIC RANK
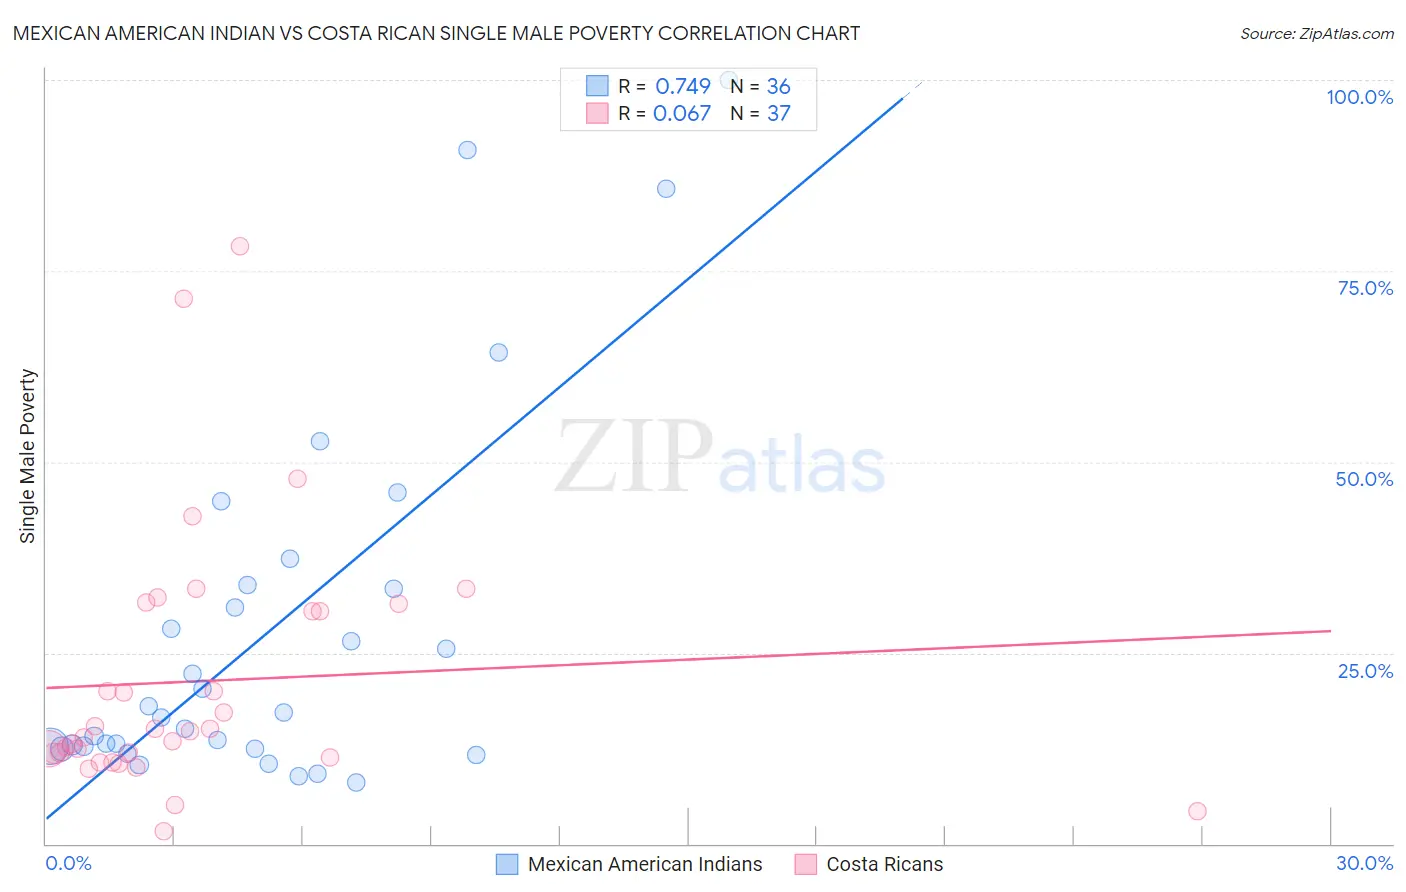
Mexican American Indian vs Costa Rican Single Male Poverty Correlation Chart
The statistical analysis conducted on geographies consisting of 294,400,440 people shows a strong positive correlation between the proportion of Mexican American Indians and poverty level among single males in the United States with a correlation coefficient (R) of 0.749 and weighted average of 13.1%. Similarly, the statistical analysis conducted on geographies consisting of 235,048,868 people shows a slight positive correlation between the proportion of Costa Ricans and poverty level among single males in the United States with a correlation coefficient (R) of 0.067 and weighted average of 12.8%, a difference of 2.0%.
Single Male Poverty Correlation Summary
| Measurement | Mexican American Indian | Costa Rican |
| Minimum | 8.1% | 1.6% |
| Maximum | 100.0% | 78.3% |
| Range | 91.9% | 76.6% |
| Mean | 27.7% | 21.3% |
| Median | 16.8% | 14.7% |
| Interquartile 25% (IQ1) | 12.6% | 11.5% |
| Interquartile 75% (IQ3) | 33.6% | 30.9% |
| Interquartile Range (IQR) | 21.0% | 19.4% |
| Standard Deviation (Sample) | 23.9% | 16.8% |
| Standard Deviation (Population) | 23.6% | 16.6% |
Similar Demographics by Single Male Poverty
Demographics Similar to Mexican American Indians by Single Male Poverty
In terms of single male poverty, the demographic groups most similar to Mexican American Indians are Immigrants from Western Africa (13.1%, a difference of 0.010%), Sudanese (13.1%, a difference of 0.020%), Immigrants from Haiti (13.1%, a difference of 0.060%), Swedish (13.1%, a difference of 0.060%), and Senegalese (13.1%, a difference of 0.10%).
| Demographics | Rating | Rank | Single Male Poverty |
| Basques | 20.7 /100 | #202 | Fair 13.0% |
| Immigrants | Bangladesh | 20.4 /100 | #203 | Fair 13.0% |
| Estonians | 20.3 /100 | #204 | Fair 13.0% |
| Poles | 19.3 /100 | #205 | Poor 13.0% |
| Northern Europeans | 18.9 /100 | #206 | Poor 13.0% |
| Sudanese | 17.7 /100 | #207 | Poor 13.1% |
| Immigrants | Western Africa | 17.6 /100 | #208 | Poor 13.1% |
| Mexican American Indians | 17.5 /100 | #209 | Poor 13.1% |
| Immigrants | Haiti | 16.8 /100 | #210 | Poor 13.1% |
| Swedes | 16.8 /100 | #211 | Poor 13.1% |
| Senegalese | 16.4 /100 | #212 | Poor 13.1% |
| Italians | 15.9 /100 | #213 | Poor 13.1% |
| Zimbabweans | 14.9 /100 | #214 | Poor 13.1% |
| Japanese | 14.8 /100 | #215 | Poor 13.1% |
| Austrians | 13.9 /100 | #216 | Poor 13.1% |
Demographics Similar to Costa Ricans by Single Male Poverty
In terms of single male poverty, the demographic groups most similar to Costa Ricans are Immigrants from St. Vincent and the Grenadines (12.8%, a difference of 0.050%), Croatian (12.8%, a difference of 0.060%), South African (12.8%, a difference of 0.080%), Danish (12.8%, a difference of 0.080%), and Syrian (12.8%, a difference of 0.080%).
| Demographics | Rating | Rank | Single Male Poverty |
| Immigrants | Sudan | 58.2 /100 | #167 | Average 12.7% |
| Immigrants | Barbados | 57.7 /100 | #168 | Average 12.7% |
| Puget Sound Salish | 54.3 /100 | #169 | Average 12.8% |
| Guyanese | 52.0 /100 | #170 | Average 12.8% |
| South Africans | 51.5 /100 | #171 | Average 12.8% |
| Danes | 51.4 /100 | #172 | Average 12.8% |
| Immigrants | St. Vincent and the Grenadines | 50.9 /100 | #173 | Average 12.8% |
| Costa Ricans | 50.0 /100 | #174 | Average 12.8% |
| Croatians | 48.9 /100 | #175 | Average 12.8% |
| Syrians | 48.4 /100 | #176 | Average 12.8% |
| Immigrants | Canada | 44.8 /100 | #177 | Average 12.8% |
| Immigrants | Switzerland | 43.1 /100 | #178 | Average 12.8% |
| Israelis | 41.0 /100 | #179 | Average 12.9% |
| Immigrants | North America | 37.7 /100 | #180 | Fair 12.9% |
| Panamanians | 37.6 /100 | #181 | Fair 12.9% |