Immigrants from Middle Africa vs Costa Rican Single Male Poverty
COMPARE
Immigrants from Middle Africa
Costa Rican
Single Male Poverty
Single Male Poverty Comparison
Immigrants from Middle Africa
Costa Ricans
12.7%
SINGLE MALE POVERTY
64.9/ 100
METRIC RATING
158th/ 347
METRIC RANK
12.8%
SINGLE MALE POVERTY
50.0/ 100
METRIC RATING
174th/ 347
METRIC RANK
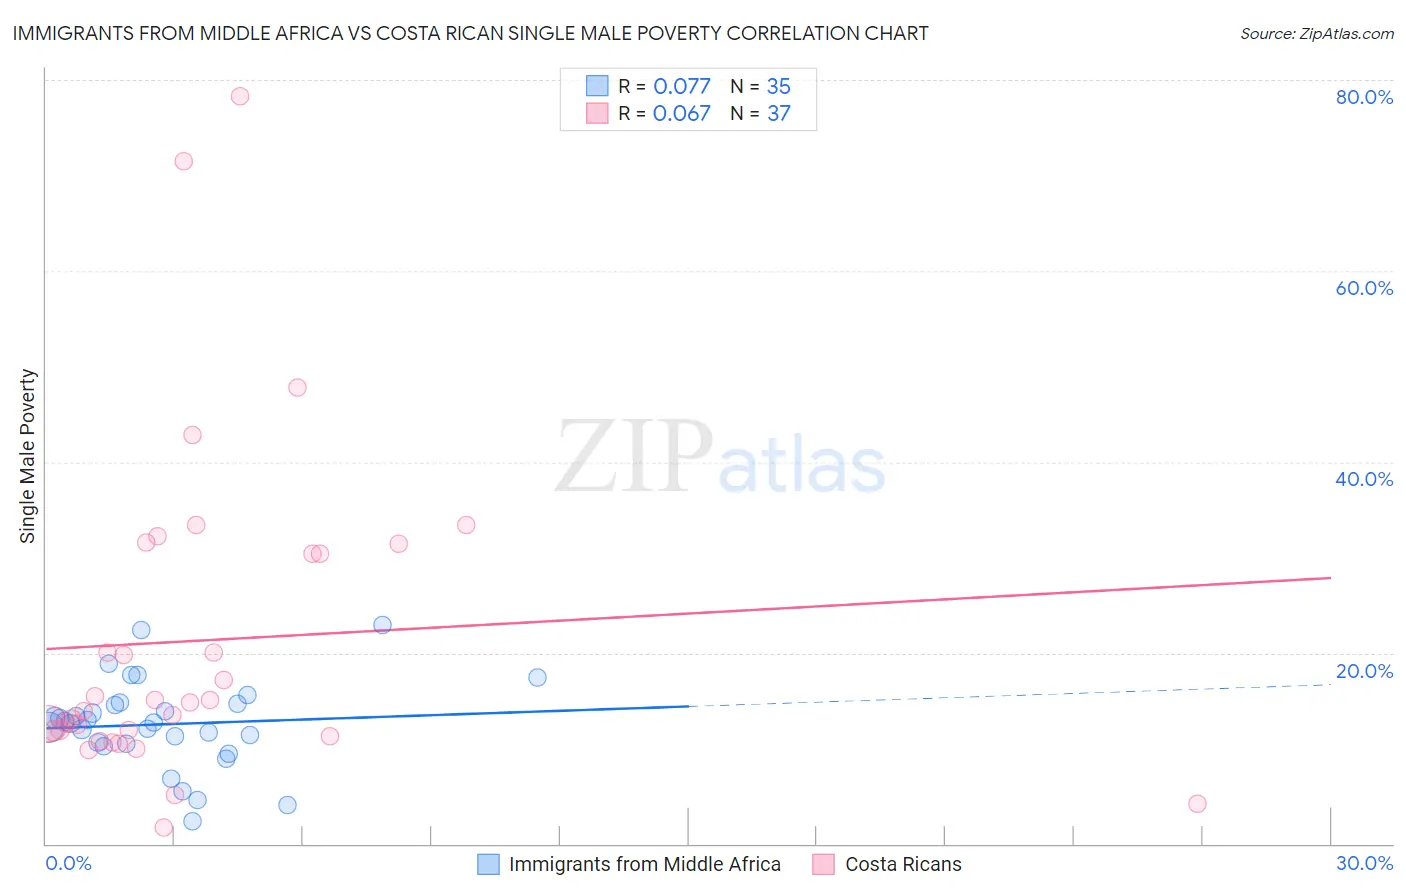
Immigrants from Middle Africa vs Costa Rican Single Male Poverty Correlation Chart
The statistical analysis conducted on geographies consisting of 190,434,572 people shows a slight positive correlation between the proportion of Immigrants from Middle Africa and poverty level among single males in the United States with a correlation coefficient (R) of 0.077 and weighted average of 12.7%. Similarly, the statistical analysis conducted on geographies consisting of 235,048,868 people shows a slight positive correlation between the proportion of Costa Ricans and poverty level among single males in the United States with a correlation coefficient (R) of 0.067 and weighted average of 12.8%, a difference of 0.81%.
Single Male Poverty Correlation Summary
| Measurement | Immigrants from Middle Africa | Costa Rican |
| Minimum | 2.3% | 1.6% |
| Maximum | 22.9% | 78.3% |
| Range | 20.5% | 76.6% |
| Mean | 12.5% | 21.3% |
| Median | 12.7% | 14.7% |
| Interquartile 25% (IQ1) | 10.5% | 11.5% |
| Interquartile 75% (IQ3) | 14.6% | 30.9% |
| Interquartile Range (IQR) | 4.1% | 19.4% |
| Standard Deviation (Sample) | 4.6% | 16.8% |
| Standard Deviation (Population) | 4.5% | 16.6% |
Demographics Similar to Immigrants from Middle Africa and Costa Ricans by Single Male Poverty
In terms of single male poverty, the demographic groups most similar to Immigrants from Middle Africa are Immigrants from Liberia (12.7%, a difference of 0.040%), Greek (12.7%, a difference of 0.040%), Immigrants from Africa (12.7%, a difference of 0.080%), Eastern European (12.7%, a difference of 0.090%), and Palestinian (12.7%, a difference of 0.10%). Similarly, the demographic groups most similar to Costa Ricans are Immigrants from St. Vincent and the Grenadines (12.8%, a difference of 0.050%), Croatian (12.8%, a difference of 0.060%), South African (12.8%, a difference of 0.080%), Danish (12.8%, a difference of 0.080%), and Syrian (12.8%, a difference of 0.080%).
| Demographics | Rating | Rank | Single Male Poverty |
| Vietnamese | 67.9 /100 | #156 | Good 12.7% |
| Latvians | 67.9 /100 | #157 | Good 12.7% |
| Immigrants | Middle Africa | 64.9 /100 | #158 | Good 12.7% |
| Immigrants | Liberia | 64.2 /100 | #159 | Good 12.7% |
| Greeks | 64.1 /100 | #160 | Good 12.7% |
| Immigrants | Africa | 63.4 /100 | #161 | Good 12.7% |
| Eastern Europeans | 63.3 /100 | #162 | Good 12.7% |
| Palestinians | 63.1 /100 | #163 | Good 12.7% |
| Immigrants | Nigeria | 62.8 /100 | #164 | Good 12.7% |
| Immigrants | Cambodia | 62.2 /100 | #165 | Good 12.7% |
| Immigrants | Guyana | 60.5 /100 | #166 | Good 12.7% |
| Immigrants | Sudan | 58.2 /100 | #167 | Average 12.7% |
| Immigrants | Barbados | 57.7 /100 | #168 | Average 12.7% |
| Puget Sound Salish | 54.3 /100 | #169 | Average 12.8% |
| Guyanese | 52.0 /100 | #170 | Average 12.8% |
| South Africans | 51.5 /100 | #171 | Average 12.8% |
| Danes | 51.4 /100 | #172 | Average 12.8% |
| Immigrants | St. Vincent and the Grenadines | 50.9 /100 | #173 | Average 12.8% |
| Costa Ricans | 50.0 /100 | #174 | Average 12.8% |
| Croatians | 48.9 /100 | #175 | Average 12.8% |
| Syrians | 48.4 /100 | #176 | Average 12.8% |