Greek vs Immigrants from Sweden Average Family Size
COMPARE
Greek
Immigrants from Sweden
Average Family Size
Average Family Size Comparison
Greeks
Immigrants from Sweden
3.14
AVERAGE FAMILY SIZE
0.3/ 100
METRIC RATING
287th/ 347
METRIC RANK
3.14
AVERAGE FAMILY SIZE
0.2/ 100
METRIC RATING
300th/ 347
METRIC RANK
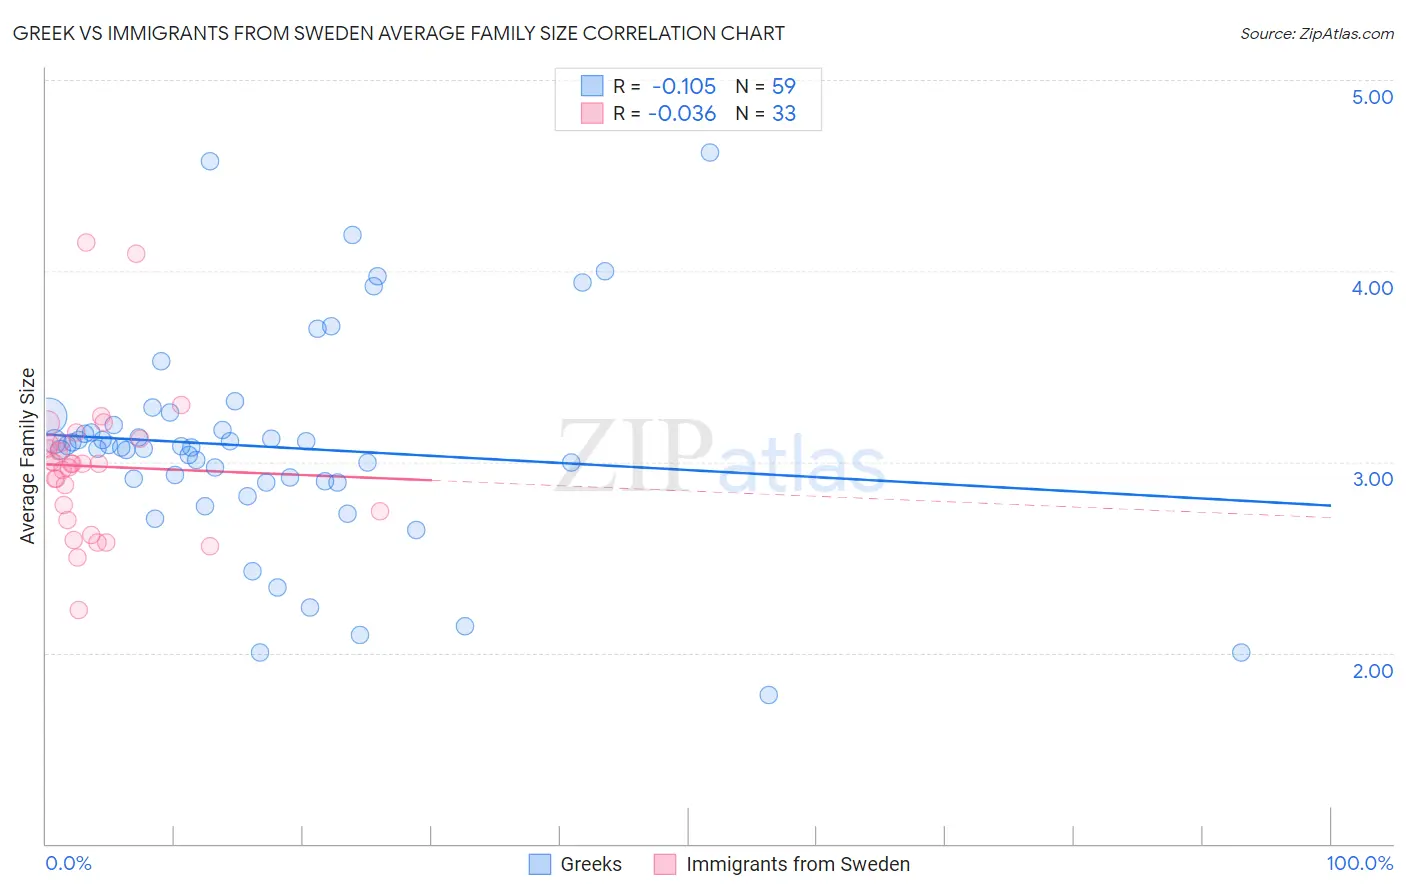
Greek vs Immigrants from Sweden Average Family Size Correlation Chart
The statistical analysis conducted on geographies consisting of 482,359,857 people shows a poor negative correlation between the proportion of Greeks and average family size in the United States with a correlation coefficient (R) of -0.105 and weighted average of 3.14. Similarly, the statistical analysis conducted on geographies consisting of 164,705,218 people shows no correlation between the proportion of Immigrants from Sweden and average family size in the United States with a correlation coefficient (R) of -0.036 and weighted average of 3.14, a difference of 0.19%.
Average Family Size Correlation Summary
| Measurement | Greek | Immigrants from Sweden |
| Minimum | 1.78 | 2.22 |
| Maximum | 4.62 | 4.15 |
| Range | 2.84 | 1.93 |
| Mean | 3.08 | 2.98 |
| Median | 3.08 | 2.99 |
| Interquartile 25% (IQ1) | 2.89 | 2.72 |
| Interquartile 75% (IQ3) | 3.19 | 3.11 |
| Interquartile Range (IQR) | 0.30 | 0.39 |
| Standard Deviation (Sample) | 0.56 | 0.39 |
| Standard Deviation (Population) | 0.56 | 0.38 |
Demographics Similar to Greeks and Immigrants from Sweden by Average Family Size
In terms of average family size, the demographic groups most similar to Greeks are Immigrants from Czechoslovakia (3.14, a difference of 0.0%), Immigrants from Norway (3.14, a difference of 0.0%), Immigrants from Netherlands (3.14, a difference of 0.010%), Cypriot (3.14, a difference of 0.030%), and White/Caucasian (3.14, a difference of 0.060%). Similarly, the demographic groups most similar to Immigrants from Sweden are Canadian (3.14, a difference of 0.010%), Immigrants from Western Europe (3.14, a difference of 0.060%), Colville (3.14, a difference of 0.060%), Immigrants from Croatia (3.14, a difference of 0.070%), and Austrian (3.14, a difference of 0.070%).
| Demographics | Rating | Rank | Average Family Size |
| German Russians | 0.4 /100 | #283 | Tragic 3.15 |
| Immigrants | France | 0.4 /100 | #284 | Tragic 3.15 |
| Whites/Caucasians | 0.3 /100 | #285 | Tragic 3.14 |
| Immigrants | Netherlands | 0.3 /100 | #286 | Tragic 3.14 |
| Greeks | 0.3 /100 | #287 | Tragic 3.14 |
| Immigrants | Czechoslovakia | 0.3 /100 | #288 | Tragic 3.14 |
| Immigrants | Norway | 0.3 /100 | #289 | Tragic 3.14 |
| Cypriots | 0.3 /100 | #290 | Tragic 3.14 |
| Alsatians | 0.2 /100 | #291 | Tragic 3.14 |
| Europeans | 0.2 /100 | #292 | Tragic 3.14 |
| Scandinavians | 0.2 /100 | #293 | Tragic 3.14 |
| Immigrants | Croatia | 0.2 /100 | #294 | Tragic 3.14 |
| Austrians | 0.2 /100 | #295 | Tragic 3.14 |
| Ukrainians | 0.2 /100 | #296 | Tragic 3.14 |
| Immigrants | Western Europe | 0.2 /100 | #297 | Tragic 3.14 |
| Colville | 0.2 /100 | #298 | Tragic 3.14 |
| Canadians | 0.2 /100 | #299 | Tragic 3.14 |
| Immigrants | Sweden | 0.2 /100 | #300 | Tragic 3.14 |
| Macedonians | 0.2 /100 | #301 | Tragic 3.13 |
| Immigrants | Latvia | 0.2 /100 | #302 | Tragic 3.13 |
| British | 0.2 /100 | #303 | Tragic 3.13 |