Ghanaian vs U.S. Virgin Islander Single Mother Households
COMPARE
Ghanaian
U.S. Virgin Islander
Single Mother Households
Single Mother Households Comparison
Ghanaians
U.S. Virgin Islanders
7.8%
SINGLE MOTHER HOUSEHOLDS
0.0/ 100
METRIC RATING
292nd/ 347
METRIC RANK
8.6%
SINGLE MOTHER HOUSEHOLDS
0.0/ 100
METRIC RATING
332nd/ 347
METRIC RANK
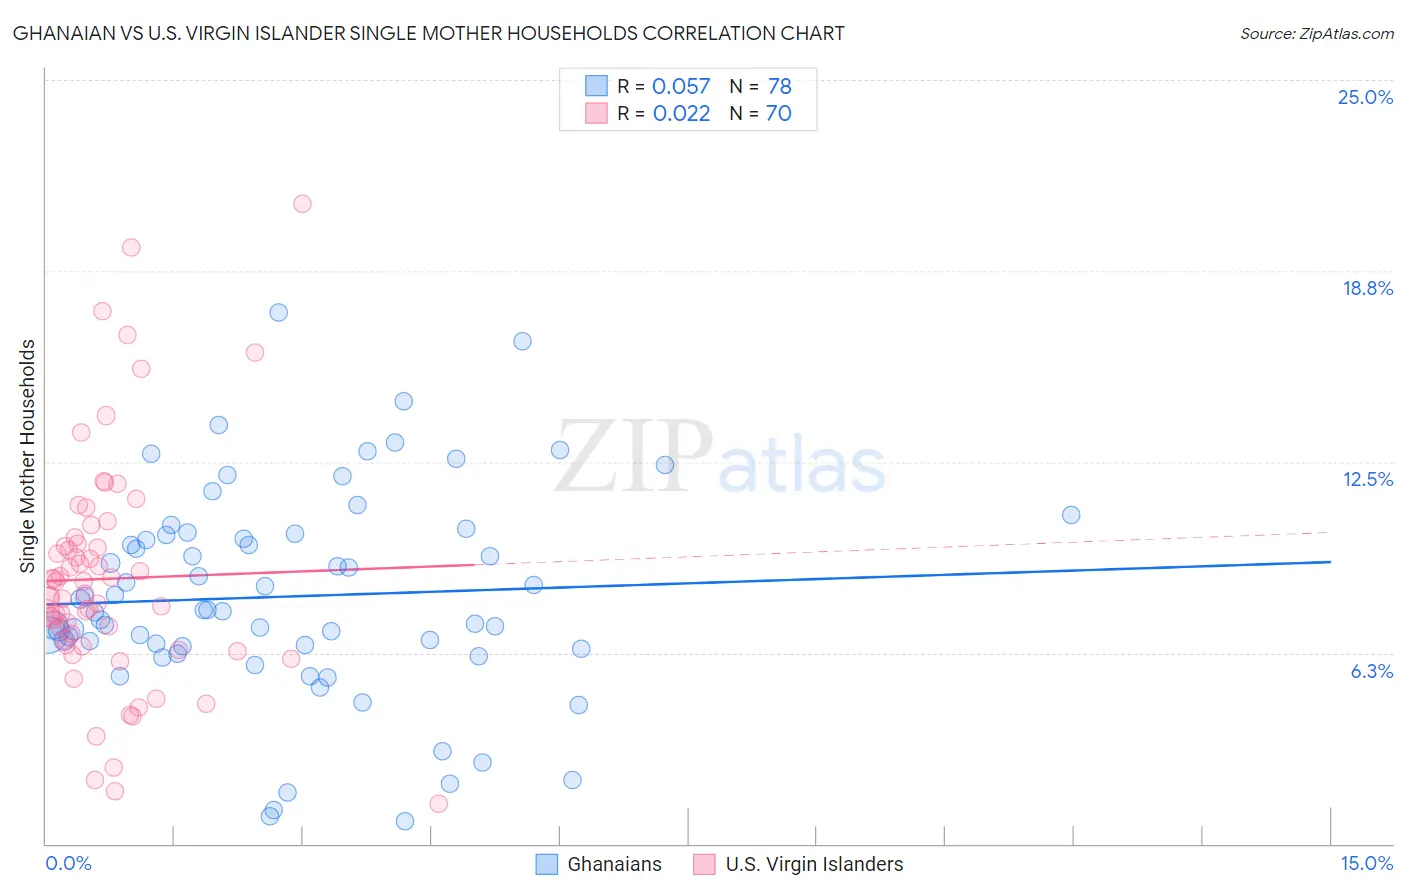
Ghanaian vs U.S. Virgin Islander Single Mother Households Correlation Chart
The statistical analysis conducted on geographies consisting of 190,389,453 people shows a slight positive correlation between the proportion of Ghanaians and percentage of single mother households in the United States with a correlation coefficient (R) of 0.057 and weighted average of 7.8%. Similarly, the statistical analysis conducted on geographies consisting of 87,484,063 people shows no correlation between the proportion of U.S. Virgin Islanders and percentage of single mother households in the United States with a correlation coefficient (R) of 0.022 and weighted average of 8.6%, a difference of 9.8%.
Single Mother Households Correlation Summary
| Measurement | Ghanaian | U.S. Virgin Islander |
| Minimum | 0.73% | 1.3% |
| Maximum | 17.4% | 21.0% |
| Range | 16.6% | 19.7% |
| Mean | 8.1% | 8.7% |
| Median | 7.6% | 8.1% |
| Interquartile 25% (IQ1) | 6.4% | 6.5% |
| Interquartile 75% (IQ3) | 10.1% | 9.8% |
| Interquartile Range (IQR) | 3.7% | 3.3% |
| Standard Deviation (Sample) | 3.4% | 3.8% |
| Standard Deviation (Population) | 3.4% | 3.8% |
Similar Demographics by Single Mother Households
Demographics Similar to Ghanaians by Single Mother Households
In terms of single mother households, the demographic groups most similar to Ghanaians are West Indian (7.8%, a difference of 0.010%), Immigrants from Nigeria (7.8%, a difference of 0.090%), Immigrants from Cameroon (7.9%, a difference of 0.36%), Apache (7.9%, a difference of 0.46%), and Subsaharan African (7.8%, a difference of 0.51%).
| Demographics | Rating | Rank | Single Mother Households |
| Trinidadians and Tobagonians | 0.0 /100 | #285 | Tragic 7.7% |
| Immigrants | Middle Africa | 0.0 /100 | #286 | Tragic 7.7% |
| Immigrants | Guatemala | 0.0 /100 | #287 | Tragic 7.7% |
| Sierra Leoneans | 0.0 /100 | #288 | Tragic 7.7% |
| Sub-Saharan Africans | 0.0 /100 | #289 | Tragic 7.8% |
| Immigrants | Nigeria | 0.0 /100 | #290 | Tragic 7.8% |
| West Indians | 0.0 /100 | #291 | Tragic 7.8% |
| Ghanaians | 0.0 /100 | #292 | Tragic 7.8% |
| Immigrants | Cameroon | 0.0 /100 | #293 | Tragic 7.9% |
| Apache | 0.0 /100 | #294 | Tragic 7.9% |
| Barbadians | 0.0 /100 | #295 | Tragic 7.9% |
| Immigrants | Latin America | 0.0 /100 | #296 | Tragic 7.9% |
| Hispanics or Latinos | 0.0 /100 | #297 | Tragic 7.9% |
| Immigrants | West Indies | 0.0 /100 | #298 | Tragic 7.9% |
| Houma | 0.0 /100 | #299 | Tragic 7.9% |
Demographics Similar to U.S. Virgin Islanders by Single Mother Households
In terms of single mother households, the demographic groups most similar to U.S. Virgin Islanders are Liberian (8.6%, a difference of 0.33%), Immigrants from Liberia (8.7%, a difference of 1.1%), Immigrants from Dominica (8.7%, a difference of 1.4%), Puerto Rican (8.7%, a difference of 1.5%), and Inupiat (8.5%, a difference of 1.5%).
| Demographics | Rating | Rank | Single Mother Households |
| Immigrants | Caribbean | 0.0 /100 | #325 | Tragic 8.4% |
| British West Indians | 0.0 /100 | #326 | Tragic 8.4% |
| Immigrants | Haiti | 0.0 /100 | #327 | Tragic 8.4% |
| Yakama | 0.0 /100 | #328 | Tragic 8.4% |
| Hopi | 0.0 /100 | #329 | Tragic 8.5% |
| Inupiat | 0.0 /100 | #330 | Tragic 8.5% |
| Sioux | 0.0 /100 | #331 | Tragic 8.5% |
| U.S. Virgin Islanders | 0.0 /100 | #332 | Tragic 8.6% |
| Liberians | 0.0 /100 | #333 | Tragic 8.6% |
| Immigrants | Liberia | 0.0 /100 | #334 | Tragic 8.7% |
| Immigrants | Dominica | 0.0 /100 | #335 | Tragic 8.7% |
| Puerto Ricans | 0.0 /100 | #336 | Tragic 8.7% |
| Navajo | 0.0 /100 | #337 | Tragic 8.8% |
| Cape Verdeans | 0.0 /100 | #338 | Tragic 8.9% |
| Blacks/African Americans | 0.0 /100 | #339 | Tragic 9.0% |