Ghanaian vs Immigrants from Trinidad and Tobago Female Poverty
COMPARE
Ghanaian
Immigrants from Trinidad and Tobago
Female Poverty
Female Poverty Comparison
Ghanaians
Immigrants from Trinidad and Tobago
14.7%
FEMALE POVERTY
1.9/ 100
METRIC RATING
229th/ 347
METRIC RANK
15.4%
FEMALE POVERTY
0.3/ 100
METRIC RATING
251st/ 347
METRIC RANK
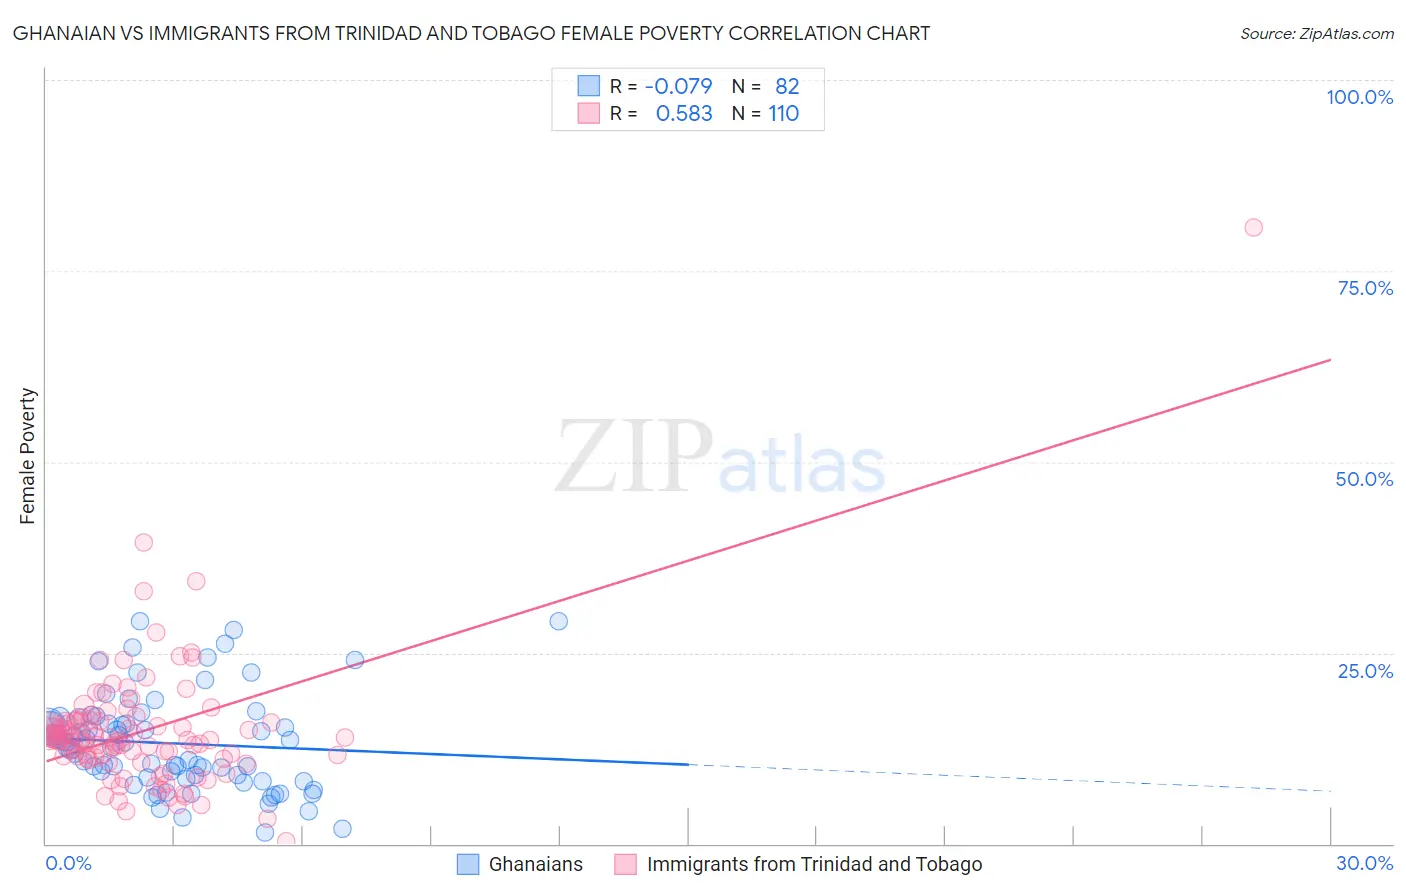
Ghanaian vs Immigrants from Trinidad and Tobago Female Poverty Correlation Chart
The statistical analysis conducted on geographies consisting of 190,346,829 people shows a slight negative correlation between the proportion of Ghanaians and poverty level among females in the United States with a correlation coefficient (R) of -0.079 and weighted average of 14.7%. Similarly, the statistical analysis conducted on geographies consisting of 223,462,695 people shows a substantial positive correlation between the proportion of Immigrants from Trinidad and Tobago and poverty level among females in the United States with a correlation coefficient (R) of 0.583 and weighted average of 15.4%, a difference of 4.4%.
Female Poverty Correlation Summary
| Measurement | Ghanaian | Immigrants from Trinidad and Tobago |
| Minimum | 1.5% | 0.35% |
| Maximum | 29.2% | 80.6% |
| Range | 27.7% | 80.3% |
| Mean | 13.2% | 14.7% |
| Median | 12.9% | 13.7% |
| Interquartile 25% (IQ1) | 8.6% | 11.4% |
| Interquartile 75% (IQ3) | 15.7% | 16.1% |
| Interquartile Range (IQR) | 7.1% | 4.7% |
| Standard Deviation (Sample) | 6.3% | 8.7% |
| Standard Deviation (Population) | 6.2% | 8.7% |
Similar Demographics by Female Poverty
Demographics Similar to Ghanaians by Female Poverty
In terms of female poverty, the demographic groups most similar to Ghanaians are German Russian (14.7%, a difference of 0.060%), Alaska Native (14.7%, a difference of 0.20%), Immigrants from Nigeria (14.7%, a difference of 0.21%), Nigerian (14.8%, a difference of 0.30%), and Immigrants from Eritrea (14.6%, a difference of 0.52%).
| Demographics | Rating | Rank | Female Poverty |
| Immigrants | Nonimmigrants | 3.7 /100 | #222 | Tragic 14.5% |
| Immigrants | Africa | 3.3 /100 | #223 | Tragic 14.5% |
| Americans | 2.8 /100 | #224 | Tragic 14.6% |
| Immigrants | Micronesia | 2.8 /100 | #225 | Tragic 14.6% |
| Immigrants | Eritrea | 2.4 /100 | #226 | Tragic 14.6% |
| Immigrants | Nigeria | 2.1 /100 | #227 | Tragic 14.7% |
| German Russians | 2.0 /100 | #228 | Tragic 14.7% |
| Ghanaians | 1.9 /100 | #229 | Tragic 14.7% |
| Alaska Natives | 1.8 /100 | #230 | Tragic 14.7% |
| Nigerians | 1.7 /100 | #231 | Tragic 14.8% |
| Osage | 1.5 /100 | #232 | Tragic 14.8% |
| Immigrants | Saudi Arabia | 1.4 /100 | #233 | Tragic 14.8% |
| Fijians | 1.1 /100 | #234 | Tragic 14.9% |
| Immigrants | Laos | 0.9 /100 | #235 | Tragic 15.0% |
| Cree | 0.7 /100 | #236 | Tragic 15.1% |
Demographics Similar to Immigrants from Trinidad and Tobago by Female Poverty
In terms of female poverty, the demographic groups most similar to Immigrants from Trinidad and Tobago are Immigrants from Burma/Myanmar (15.4%, a difference of 0.030%), Immigrants from Western Africa (15.3%, a difference of 0.16%), Salvadoran (15.3%, a difference of 0.20%), Liberian (15.4%, a difference of 0.30%), and Immigrants from Ghana (15.3%, a difference of 0.34%).
| Demographics | Rating | Rank | Female Poverty |
| Ecuadorians | 0.3 /100 | #244 | Tragic 15.3% |
| Spanish American Indians | 0.3 /100 | #245 | Tragic 15.3% |
| Cubans | 0.3 /100 | #246 | Tragic 15.3% |
| Potawatomi | 0.3 /100 | #247 | Tragic 15.3% |
| Immigrants | Ghana | 0.3 /100 | #248 | Tragic 15.3% |
| Salvadorans | 0.3 /100 | #249 | Tragic 15.3% |
| Immigrants | Western Africa | 0.3 /100 | #250 | Tragic 15.3% |
| Immigrants | Trinidad and Tobago | 0.3 /100 | #251 | Tragic 15.4% |
| Immigrants | Burma/Myanmar | 0.3 /100 | #252 | Tragic 15.4% |
| Liberians | 0.2 /100 | #253 | Tragic 15.4% |
| Trinidadians and Tobagonians | 0.2 /100 | #254 | Tragic 15.4% |
| Ottawa | 0.2 /100 | #255 | Tragic 15.5% |
| Jamaicans | 0.2 /100 | #256 | Tragic 15.5% |
| Immigrants | Jamaica | 0.1 /100 | #257 | Tragic 15.6% |
| Shoshone | 0.1 /100 | #258 | Tragic 15.6% |