German Russian vs Immigrants from Bahamas Married-Couple Family Poverty
COMPARE
German Russian
Immigrants from Bahamas
Married-Couple Family Poverty
Married-Couple Family Poverty Comparison
German Russians
Immigrants from Bahamas
5.0%
MARRIED-COUPLE FAMILY POVERTY
85.1/ 100
METRIC RATING
139th/ 347
METRIC RANK
6.2%
MARRIED-COUPLE FAMILY POVERTY
0.1/ 100
METRIC RATING
271st/ 347
METRIC RANK
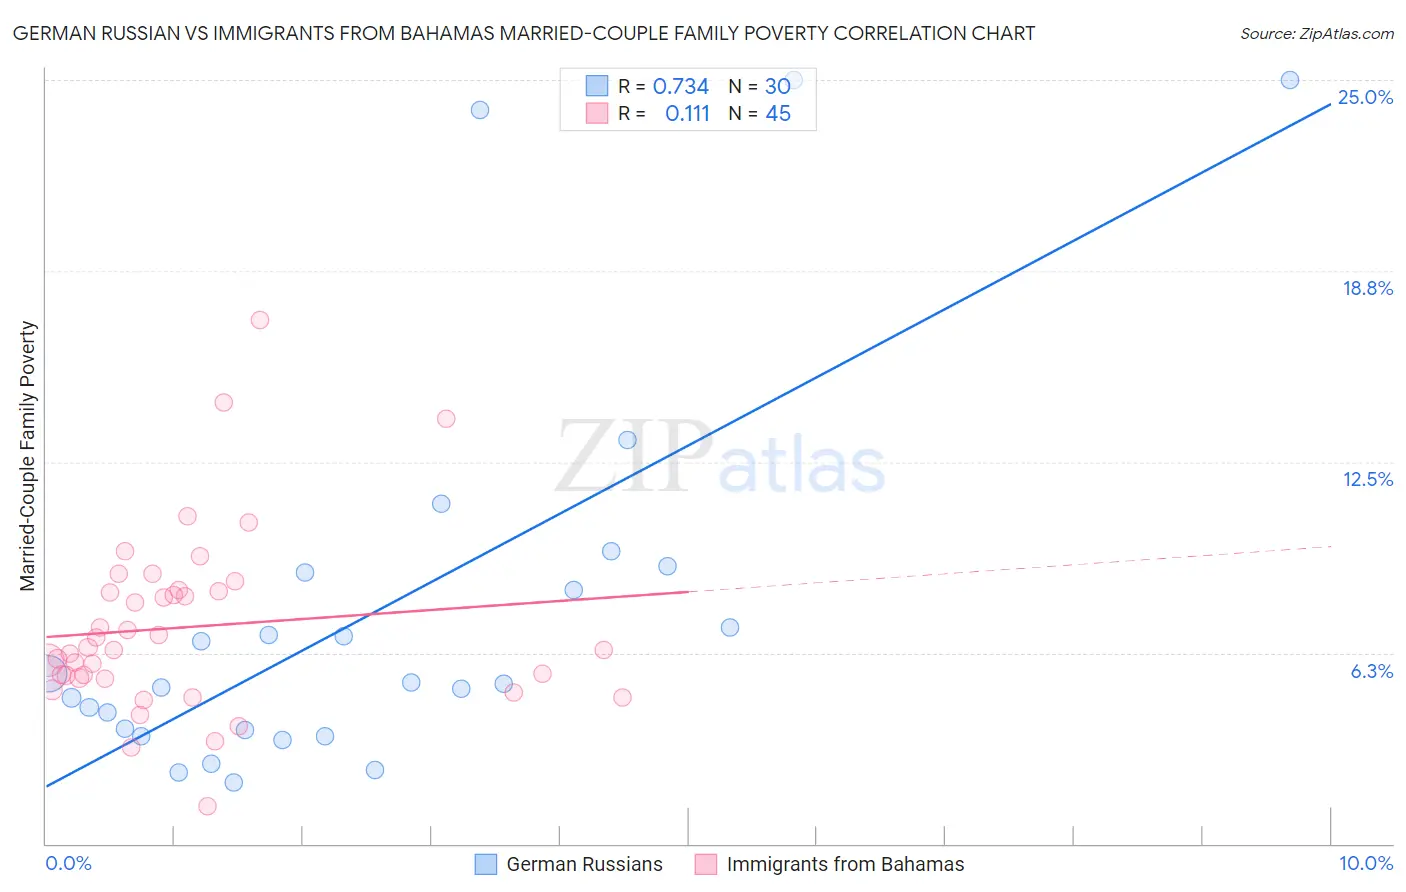
German Russian vs Immigrants from Bahamas Married-Couple Family Poverty Correlation Chart
The statistical analysis conducted on geographies consisting of 96,237,761 people shows a strong positive correlation between the proportion of German Russians and poverty level among married-couple families in the United States with a correlation coefficient (R) of 0.734 and weighted average of 5.0%. Similarly, the statistical analysis conducted on geographies consisting of 104,426,116 people shows a poor positive correlation between the proportion of Immigrants from Bahamas and poverty level among married-couple families in the United States with a correlation coefficient (R) of 0.111 and weighted average of 6.2%, a difference of 25.8%.
Married-Couple Family Poverty Correlation Summary
| Measurement | German Russian | Immigrants from Bahamas |
| Minimum | 2.0% | 1.2% |
| Maximum | 25.0% | 17.1% |
| Range | 23.0% | 15.9% |
| Mean | 7.6% | 7.1% |
| Median | 5.3% | 6.4% |
| Interquartile 25% (IQ1) | 3.7% | 5.4% |
| Interquartile 75% (IQ3) | 8.9% | 8.3% |
| Interquartile Range (IQR) | 5.1% | 2.9% |
| Standard Deviation (Sample) | 6.4% | 3.0% |
| Standard Deviation (Population) | 6.3% | 2.9% |
Similar Demographics by Married-Couple Family Poverty
Demographics Similar to German Russians by Married-Couple Family Poverty
In terms of married-couple family poverty, the demographic groups most similar to German Russians are Immigrants from Portugal (5.0%, a difference of 0.060%), Immigrants from Brazil (5.0%, a difference of 0.11%), Immigrants from China (5.0%, a difference of 0.11%), Chilean (4.9%, a difference of 0.23%), and Guamanian/Chamorro (4.9%, a difference of 0.36%).
| Demographics | Rating | Rank | Married-Couple Family Poverty |
| Puget Sound Salish | 90.4 /100 | #132 | Exceptional 4.9% |
| Immigrants | Kenya | 90.2 /100 | #133 | Exceptional 4.9% |
| Samoans | 90.2 /100 | #134 | Exceptional 4.9% |
| Assyrians/Chaldeans/Syriacs | 89.4 /100 | #135 | Excellent 4.9% |
| Immigrants | Hungary | 88.7 /100 | #136 | Excellent 4.9% |
| Guamanians/Chamorros | 86.5 /100 | #137 | Excellent 4.9% |
| Chileans | 86.0 /100 | #138 | Excellent 4.9% |
| German Russians | 85.1 /100 | #139 | Excellent 5.0% |
| Immigrants | Portugal | 84.8 /100 | #140 | Excellent 5.0% |
| Immigrants | Brazil | 84.6 /100 | #141 | Excellent 5.0% |
| Immigrants | China | 84.6 /100 | #142 | Excellent 5.0% |
| Immigrants | Egypt | 83.4 /100 | #143 | Excellent 5.0% |
| Hmong | 83.2 /100 | #144 | Excellent 5.0% |
| Immigrants | Spain | 79.9 /100 | #145 | Good 5.0% |
| Mongolians | 79.8 /100 | #146 | Good 5.0% |
Demographics Similar to Immigrants from Bahamas by Married-Couple Family Poverty
In terms of married-couple family poverty, the demographic groups most similar to Immigrants from Bahamas are Trinidadian and Tobagonian (6.2%, a difference of 0.030%), Immigrants from Jamaica (6.2%, a difference of 0.22%), Immigrants from West Indies (6.2%, a difference of 0.26%), Alaska Native (6.2%, a difference of 0.43%), and Colville (6.3%, a difference of 0.81%).
| Demographics | Rating | Rank | Married-Couple Family Poverty |
| Immigrants | Congo | 0.2 /100 | #264 | Tragic 6.1% |
| Blackfeet | 0.2 /100 | #265 | Tragic 6.2% |
| Creek | 0.2 /100 | #266 | Tragic 6.2% |
| Spanish Americans | 0.2 /100 | #267 | Tragic 6.2% |
| Alaska Natives | 0.2 /100 | #268 | Tragic 6.2% |
| Immigrants | West Indies | 0.1 /100 | #269 | Tragic 6.2% |
| Immigrants | Jamaica | 0.1 /100 | #270 | Tragic 6.2% |
| Immigrants | Bahamas | 0.1 /100 | #271 | Tragic 6.2% |
| Trinidadians and Tobagonians | 0.1 /100 | #272 | Tragic 6.2% |
| Colville | 0.1 /100 | #273 | Tragic 6.3% |
| Barbadians | 0.1 /100 | #274 | Tragic 6.3% |
| Choctaw | 0.1 /100 | #275 | Tragic 6.3% |
| Yaqui | 0.1 /100 | #276 | Tragic 6.3% |
| Indonesians | 0.1 /100 | #277 | Tragic 6.3% |
| Immigrants | Trinidad and Tobago | 0.1 /100 | #278 | Tragic 6.4% |