Immigrants from Ireland vs Immigrants from Africa Female Poverty
COMPARE
Immigrants from Ireland
Immigrants from Africa
Female Poverty
Female Poverty Comparison
Immigrants from Ireland
Immigrants from Africa
11.0%
FEMALE POVERTY
99.9/ 100
METRIC RATING
6th/ 347
METRIC RANK
14.5%
FEMALE POVERTY
3.3/ 100
METRIC RATING
223rd/ 347
METRIC RANK
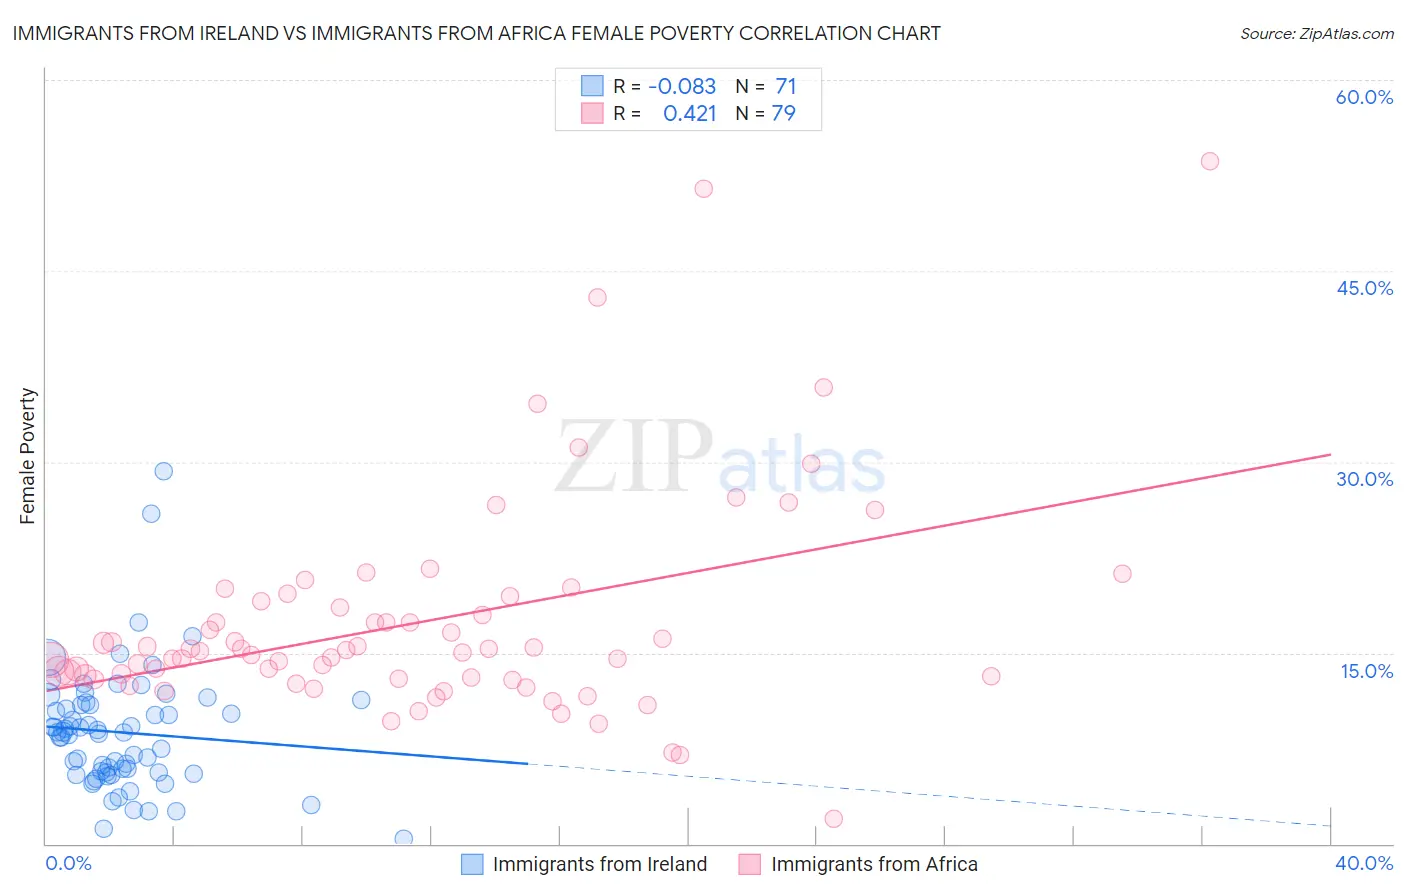
Immigrants from Ireland vs Immigrants from Africa Female Poverty Correlation Chart
The statistical analysis conducted on geographies consisting of 240,733,190 people shows a slight negative correlation between the proportion of Immigrants from Ireland and poverty level among females in the United States with a correlation coefficient (R) of -0.083 and weighted average of 11.0%. Similarly, the statistical analysis conducted on geographies consisting of 468,810,644 people shows a moderate positive correlation between the proportion of Immigrants from Africa and poverty level among females in the United States with a correlation coefficient (R) of 0.421 and weighted average of 14.5%, a difference of 32.2%.
Female Poverty Correlation Summary
| Measurement | Immigrants from Ireland | Immigrants from Africa |
| Minimum | 0.42% | 1.9% |
| Maximum | 29.3% | 53.6% |
| Range | 28.9% | 51.7% |
| Mean | 8.7% | 17.4% |
| Median | 8.8% | 15.1% |
| Interquartile 25% (IQ1) | 5.6% | 12.9% |
| Interquartile 75% (IQ3) | 10.9% | 19.0% |
| Interquartile Range (IQR) | 5.3% | 6.1% |
| Standard Deviation (Sample) | 4.8% | 8.7% |
| Standard Deviation (Population) | 4.8% | 8.6% |
Similar Demographics by Female Poverty
Demographics Similar to Immigrants from Ireland by Female Poverty
In terms of female poverty, the demographic groups most similar to Immigrants from Ireland are Assyrian/Chaldean/Syriac (11.0%, a difference of 0.37%), Filipino (10.9%, a difference of 0.38%), Immigrants from South Central Asia (11.1%, a difference of 1.1%), Bulgarian (11.1%, a difference of 1.3%), and Immigrants from Hong Kong (11.2%, a difference of 2.1%).
| Demographics | Rating | Rank | Female Poverty |
| Immigrants | India | 100.0 /100 | #1 | Exceptional 9.9% |
| Chinese | 100.0 /100 | #2 | Exceptional 10.4% |
| Thais | 100.0 /100 | #3 | Exceptional 10.5% |
| Immigrants | Taiwan | 100.0 /100 | #4 | Exceptional 10.5% |
| Filipinos | 100.0 /100 | #5 | Exceptional 10.9% |
| Immigrants | Ireland | 99.9 /100 | #6 | Exceptional 11.0% |
| Assyrians/Chaldeans/Syriacs | 99.9 /100 | #7 | Exceptional 11.0% |
| Immigrants | South Central Asia | 99.9 /100 | #8 | Exceptional 11.1% |
| Bulgarians | 99.9 /100 | #9 | Exceptional 11.1% |
| Immigrants | Hong Kong | 99.9 /100 | #10 | Exceptional 11.2% |
| Maltese | 99.9 /100 | #11 | Exceptional 11.2% |
| Bhutanese | 99.9 /100 | #12 | Exceptional 11.3% |
| Immigrants | Lithuania | 99.9 /100 | #13 | Exceptional 11.3% |
| Lithuanians | 99.8 /100 | #14 | Exceptional 11.4% |
| Latvians | 99.8 /100 | #15 | Exceptional 11.4% |
Demographics Similar to Immigrants from Africa by Female Poverty
In terms of female poverty, the demographic groups most similar to Immigrants from Africa are Nonimmigrants (14.5%, a difference of 0.23%), Immigrants from Cambodia (14.5%, a difference of 0.26%), American (14.6%, a difference of 0.39%), Immigrants from Micronesia (14.6%, a difference of 0.40%), and Alsatian (14.5%, a difference of 0.45%).
| Demographics | Rating | Rank | Female Poverty |
| Immigrants | Thailand | 4.5 /100 | #216 | Tragic 14.4% |
| Immigrants | Immigrants | 4.5 /100 | #217 | Tragic 14.4% |
| Immigrants | Uzbekistan | 4.4 /100 | #218 | Tragic 14.4% |
| Japanese | 4.1 /100 | #219 | Tragic 14.5% |
| Alsatians | 4.0 /100 | #220 | Tragic 14.5% |
| Immigrants | Cambodia | 3.7 /100 | #221 | Tragic 14.5% |
| Immigrants | Nonimmigrants | 3.7 /100 | #222 | Tragic 14.5% |
| Immigrants | Africa | 3.3 /100 | #223 | Tragic 14.5% |
| Americans | 2.8 /100 | #224 | Tragic 14.6% |
| Immigrants | Micronesia | 2.8 /100 | #225 | Tragic 14.6% |
| Immigrants | Eritrea | 2.4 /100 | #226 | Tragic 14.6% |
| Immigrants | Nigeria | 2.1 /100 | #227 | Tragic 14.7% |
| German Russians | 2.0 /100 | #228 | Tragic 14.7% |
| Ghanaians | 1.9 /100 | #229 | Tragic 14.7% |
| Alaska Natives | 1.8 /100 | #230 | Tragic 14.7% |