French Canadian vs Samoan 12th Grade, No Diploma
COMPARE
French Canadian
Samoan
12th Grade, No Diploma
12th Grade, No Diploma Comparison
French Canadians
Samoans
92.6%
12TH GRADE, NO DIPLOMA
99.3/ 100
METRIC RATING
80th/ 347
METRIC RANK
90.8%
12TH GRADE, NO DIPLOMA
20.4/ 100
METRIC RATING
198th/ 347
METRIC RANK
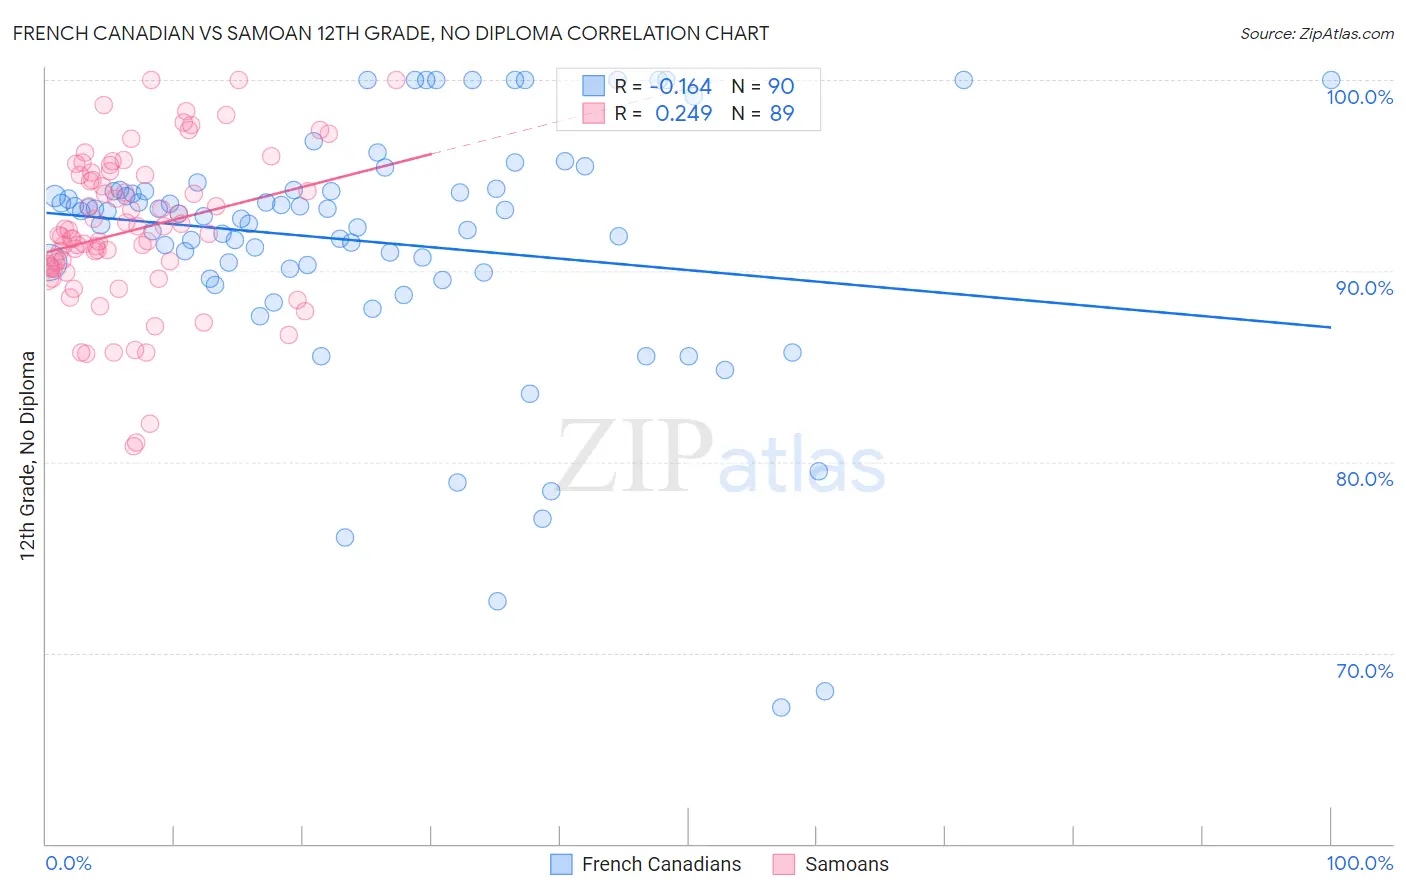
French Canadian vs Samoan 12th Grade, No Diploma Correlation Chart
The statistical analysis conducted on geographies consisting of 502,678,956 people shows a poor negative correlation between the proportion of French Canadians and percentage of population with at least 12th grade (no diploma) education in the United States with a correlation coefficient (R) of -0.164 and weighted average of 92.6%. Similarly, the statistical analysis conducted on geographies consisting of 225,206,099 people shows a weak positive correlation between the proportion of Samoans and percentage of population with at least 12th grade (no diploma) education in the United States with a correlation coefficient (R) of 0.249 and weighted average of 90.8%, a difference of 1.9%.
12th Grade, No Diploma Correlation Summary
| Measurement | French Canadian | Samoan |
| Minimum | 67.1% | 80.8% |
| Maximum | 100.0% | 100.0% |
| Range | 32.9% | 19.2% |
| Mean | 91.5% | 92.1% |
| Median | 93.0% | 91.9% |
| Interquartile 25% (IQ1) | 90.1% | 90.2% |
| Interquartile 75% (IQ3) | 94.2% | 95.0% |
| Interquartile Range (IQR) | 4.1% | 4.9% |
| Standard Deviation (Sample) | 6.6% | 4.0% |
| Standard Deviation (Population) | 6.6% | 4.0% |
Similar Demographics by 12th Grade, No Diploma
Demographics Similar to French Canadians by 12th Grade, No Diploma
In terms of 12th grade, no diploma, the demographic groups most similar to French Canadians are Romanian (92.6%, a difference of 0.010%), Cambodian (92.6%, a difference of 0.020%), Immigrants from Denmark (92.5%, a difference of 0.020%), Immigrants from Switzerland (92.5%, a difference of 0.020%), and Immigrants from Israel (92.5%, a difference of 0.030%).
| Demographics | Rating | Rank | 12th Grade, No Diploma |
| Burmese | 99.4 /100 | #73 | Exceptional 92.6% |
| Immigrants | Moldova | 99.4 /100 | #74 | Exceptional 92.6% |
| Native Hawaiians | 99.4 /100 | #75 | Exceptional 92.6% |
| French | 99.4 /100 | #76 | Exceptional 92.6% |
| Immigrants | England | 99.4 /100 | #77 | Exceptional 92.6% |
| Cambodians | 99.3 /100 | #78 | Exceptional 92.6% |
| Romanians | 99.3 /100 | #79 | Exceptional 92.6% |
| French Canadians | 99.3 /100 | #80 | Exceptional 92.6% |
| Immigrants | Denmark | 99.2 /100 | #81 | Exceptional 92.5% |
| Immigrants | Switzerland | 99.2 /100 | #82 | Exceptional 92.5% |
| Immigrants | Israel | 99.2 /100 | #83 | Exceptional 92.5% |
| Immigrants | Bulgaria | 99.1 /100 | #84 | Exceptional 92.5% |
| Immigrants | Saudi Arabia | 99.0 /100 | #85 | Exceptional 92.5% |
| Immigrants | Turkey | 98.9 /100 | #86 | Exceptional 92.4% |
| Immigrants | France | 98.8 /100 | #87 | Exceptional 92.4% |
Demographics Similar to Samoans by 12th Grade, No Diploma
In terms of 12th grade, no diploma, the demographic groups most similar to Samoans are Immigrants from Southern Europe (90.8%, a difference of 0.010%), Liberian (90.8%, a difference of 0.010%), Hawaiian (90.8%, a difference of 0.010%), Panamanian (90.8%, a difference of 0.040%), and Immigrants from Sudan (90.8%, a difference of 0.040%).
| Demographics | Rating | Rank | 12th Grade, No Diploma |
| Moroccans | 28.8 /100 | #191 | Fair 90.9% |
| Immigrants | Eastern Africa | 27.7 /100 | #192 | Fair 90.9% |
| Immigrants | Ethiopia | 27.2 /100 | #193 | Fair 90.9% |
| Immigrants | Oceania | 26.0 /100 | #194 | Fair 90.9% |
| Koreans | 24.5 /100 | #195 | Fair 90.8% |
| Panamanians | 22.8 /100 | #196 | Fair 90.8% |
| Immigrants | Sudan | 22.6 /100 | #197 | Fair 90.8% |
| Samoans | 20.4 /100 | #198 | Fair 90.8% |
| Immigrants | Southern Europe | 19.9 /100 | #199 | Poor 90.8% |
| Liberians | 19.8 /100 | #200 | Poor 90.8% |
| Hawaiians | 19.7 /100 | #201 | Poor 90.8% |
| Marshallese | 18.2 /100 | #202 | Poor 90.7% |
| Tongans | 16.1 /100 | #203 | Poor 90.7% |
| French American Indians | 15.5 /100 | #204 | Poor 90.7% |
| Immigrants | Sierra Leone | 14.9 /100 | #205 | Poor 90.7% |