French American Indian vs Alaskan Athabascan Female Poverty Among 25-34 Year Olds
COMPARE
French American Indian
Alaskan Athabascan
Female Poverty Among 25-34 Year Olds
Female Poverty Among 25-34 Year Olds Comparison
French American Indians
Alaskan Athabascans
15.9%
FEMALE POVERTY AMONG 25-34 YEAR OLDS
0.0/ 100
METRIC RATING
278th/ 347
METRIC RANK
19.1%
FEMALE POVERTY AMONG 25-34 YEAR OLDS
0.0/ 100
METRIC RATING
328th/ 347
METRIC RANK
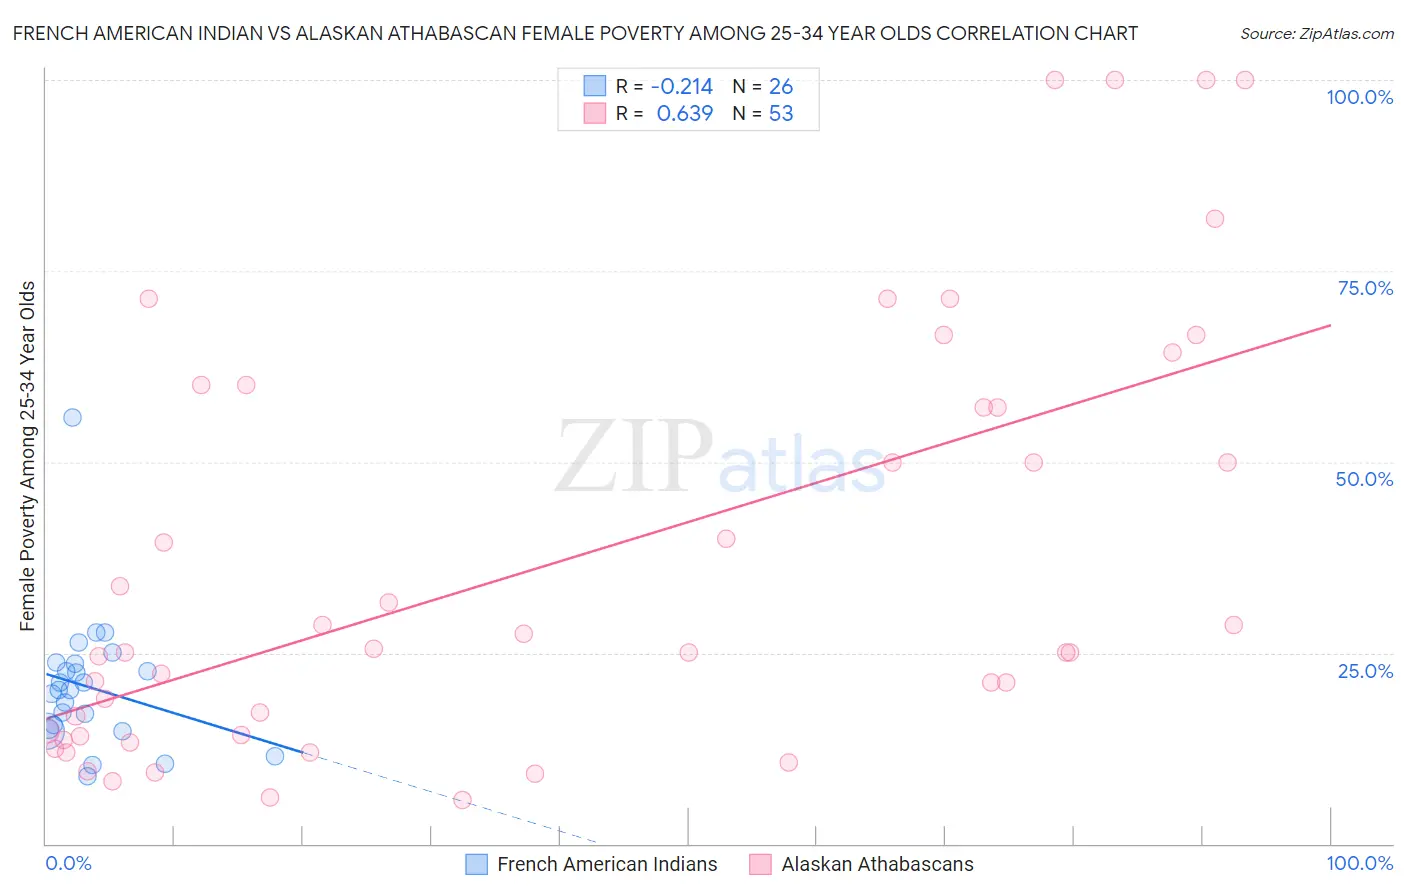
French American Indian vs Alaskan Athabascan Female Poverty Among 25-34 Year Olds Correlation Chart
The statistical analysis conducted on geographies consisting of 131,099,782 people shows a weak negative correlation between the proportion of French American Indians and poverty level among females between the ages 25 and 34 in the United States with a correlation coefficient (R) of -0.214 and weighted average of 15.9%. Similarly, the statistical analysis conducted on geographies consisting of 45,660,440 people shows a significant positive correlation between the proportion of Alaskan Athabascans and poverty level among females between the ages 25 and 34 in the United States with a correlation coefficient (R) of 0.639 and weighted average of 19.1%, a difference of 20.3%.
Female Poverty Among 25-34 Year Olds Correlation Summary
| Measurement | French American Indian | Alaskan Athabascan |
| Minimum | 8.8% | 5.7% |
| Maximum | 55.9% | 100.0% |
| Range | 47.1% | 94.3% |
| Mean | 20.5% | 37.0% |
| Median | 20.1% | 25.0% |
| Interquartile 25% (IQ1) | 15.0% | 14.2% |
| Interquartile 75% (IQ3) | 23.6% | 58.6% |
| Interquartile Range (IQR) | 8.7% | 44.4% |
| Standard Deviation (Sample) | 9.0% | 27.7% |
| Standard Deviation (Population) | 8.8% | 27.4% |
Similar Demographics by Female Poverty Among 25-34 Year Olds
Demographics Similar to French American Indians by Female Poverty Among 25-34 Year Olds
In terms of female poverty among 25-34 year olds, the demographic groups most similar to French American Indians are Fijian (15.9%, a difference of 0.0%), Bangladeshi (15.9%, a difference of 0.16%), Immigrants from Micronesia (15.8%, a difference of 0.29%), Immigrants from Zaire (15.8%, a difference of 0.30%), and Immigrants from Latin America (16.0%, a difference of 0.67%).
| Demographics | Rating | Rank | Female Poverty Among 25-34 Year Olds |
| Cree | 0.1 /100 | #271 | Tragic 15.6% |
| Senegalese | 0.1 /100 | #272 | Tragic 15.6% |
| Immigrants | Nonimmigrants | 0.1 /100 | #273 | Tragic 15.6% |
| Immigrants | Caribbean | 0.0 /100 | #274 | Tragic 15.7% |
| Immigrants | Azores | 0.0 /100 | #275 | Tragic 15.8% |
| Immigrants | Zaire | 0.0 /100 | #276 | Tragic 15.8% |
| Immigrants | Micronesia | 0.0 /100 | #277 | Tragic 15.8% |
| French American Indians | 0.0 /100 | #278 | Tragic 15.9% |
| Fijians | 0.0 /100 | #279 | Tragic 15.9% |
| Bangladeshis | 0.0 /100 | #280 | Tragic 15.9% |
| Immigrants | Latin America | 0.0 /100 | #281 | Tragic 16.0% |
| Aleuts | 0.0 /100 | #282 | Tragic 16.1% |
| Bahamians | 0.0 /100 | #283 | Tragic 16.1% |
| Shoshone | 0.0 /100 | #284 | Tragic 16.2% |
| Immigrants | Bahamas | 0.0 /100 | #285 | Tragic 16.3% |
Demographics Similar to Alaskan Athabascans by Female Poverty Among 25-34 Year Olds
In terms of female poverty among 25-34 year olds, the demographic groups most similar to Alaskan Athabascans are Cheyenne (19.1%, a difference of 0.080%), Creek (19.2%, a difference of 0.25%), Black/African American (18.9%, a difference of 1.0%), Paiute (19.6%, a difference of 2.5%), and Kiowa (19.7%, a difference of 2.9%).
| Demographics | Rating | Rank | Female Poverty Among 25-34 Year Olds |
| Choctaw | 0.0 /100 | #321 | Tragic 18.1% |
| Central American Indians | 0.0 /100 | #322 | Tragic 18.2% |
| Seminole | 0.0 /100 | #323 | Tragic 18.3% |
| Dutch West Indians | 0.0 /100 | #324 | Tragic 18.4% |
| Inupiat | 0.0 /100 | #325 | Tragic 18.5% |
| Blacks/African Americans | 0.0 /100 | #326 | Tragic 18.9% |
| Cheyenne | 0.0 /100 | #327 | Tragic 19.1% |
| Alaskan Athabascans | 0.0 /100 | #328 | Tragic 19.1% |
| Creek | 0.0 /100 | #329 | Tragic 19.2% |
| Paiute | 0.0 /100 | #330 | Tragic 19.6% |
| Kiowa | 0.0 /100 | #331 | Tragic 19.7% |
| Immigrants | Yemen | 0.0 /100 | #332 | Tragic 19.8% |
| Cajuns | 0.0 /100 | #333 | Tragic 19.9% |
| Apache | 0.0 /100 | #334 | Tragic 20.1% |
| Natives/Alaskans | 0.0 /100 | #335 | Tragic 20.3% |