Eastern European vs Alaskan Athabascan Female Poverty Among 25-34 Year Olds
COMPARE
Eastern European
Alaskan Athabascan
Female Poverty Among 25-34 Year Olds
Female Poverty Among 25-34 Year Olds Comparison
Eastern Europeans
Alaskan Athabascans
12.0%
FEMALE POVERTY AMONG 25-34 YEAR OLDS
99.6/ 100
METRIC RATING
54th/ 347
METRIC RANK
19.1%
FEMALE POVERTY AMONG 25-34 YEAR OLDS
0.0/ 100
METRIC RATING
328th/ 347
METRIC RANK
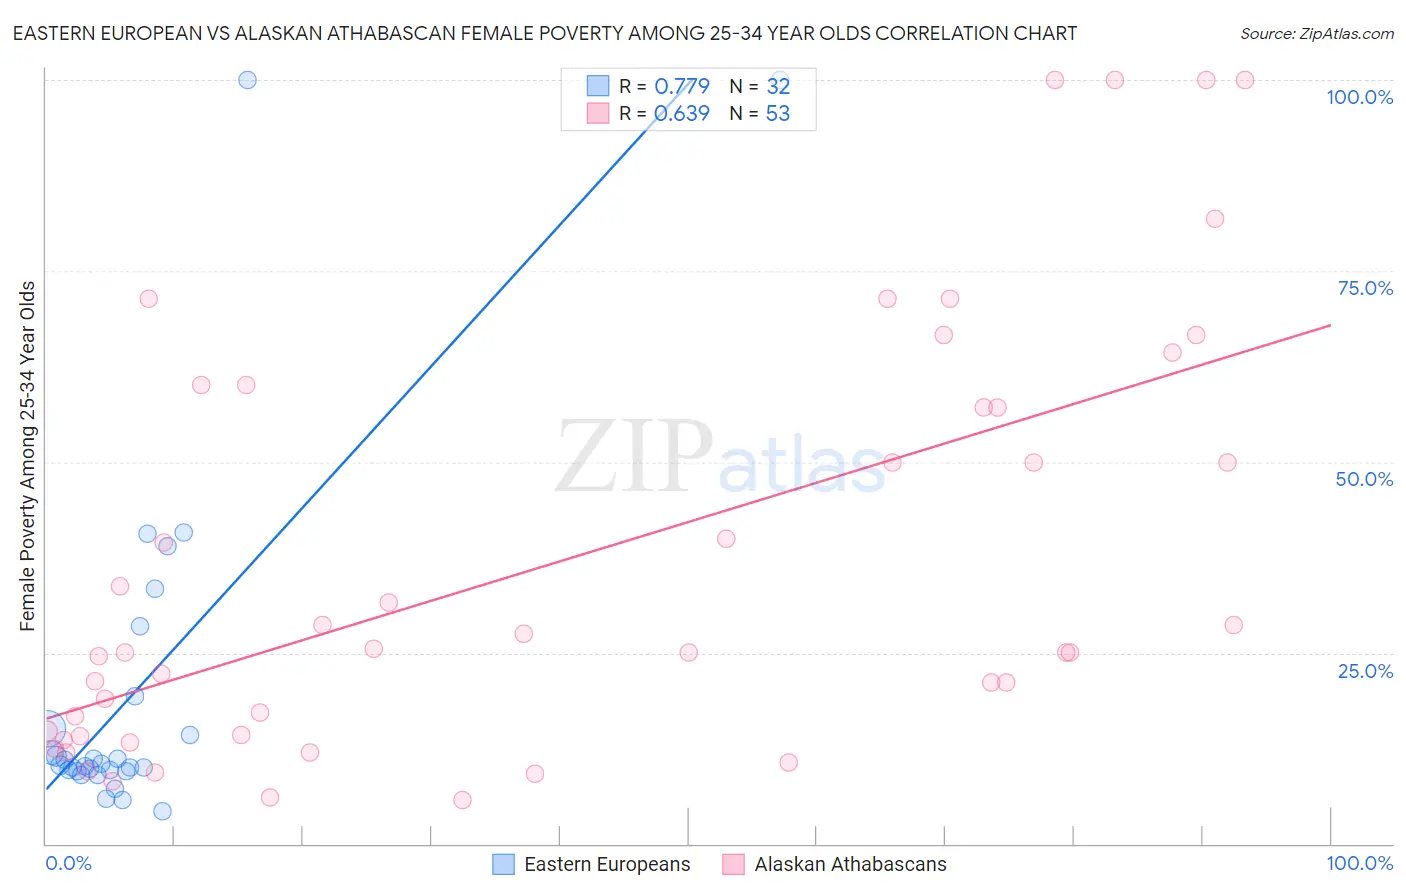
Eastern European vs Alaskan Athabascan Female Poverty Among 25-34 Year Olds Correlation Chart
The statistical analysis conducted on geographies consisting of 449,003,050 people shows a strong positive correlation between the proportion of Eastern Europeans and poverty level among females between the ages 25 and 34 in the United States with a correlation coefficient (R) of 0.779 and weighted average of 12.0%. Similarly, the statistical analysis conducted on geographies consisting of 45,660,440 people shows a significant positive correlation between the proportion of Alaskan Athabascans and poverty level among females between the ages 25 and 34 in the United States with a correlation coefficient (R) of 0.639 and weighted average of 19.1%, a difference of 59.1%.
Female Poverty Among 25-34 Year Olds Correlation Summary
| Measurement | Eastern European | Alaskan Athabascan |
| Minimum | 4.3% | 5.7% |
| Maximum | 100.0% | 100.0% |
| Range | 95.7% | 94.3% |
| Mean | 19.9% | 37.0% |
| Median | 10.4% | 25.0% |
| Interquartile 25% (IQ1) | 9.6% | 14.2% |
| Interquartile 75% (IQ3) | 17.2% | 58.6% |
| Interquartile Range (IQR) | 7.6% | 44.4% |
| Standard Deviation (Sample) | 23.3% | 27.7% |
| Standard Deviation (Population) | 23.0% | 27.4% |
Similar Demographics by Female Poverty Among 25-34 Year Olds
Demographics Similar to Eastern Europeans by Female Poverty Among 25-34 Year Olds
In terms of female poverty among 25-34 year olds, the demographic groups most similar to Eastern Europeans are Immigrants from Israel (12.0%, a difference of 0.12%), Immigrants from Philippines (12.0%, a difference of 0.17%), Immigrants from Eastern Europe (12.0%, a difference of 0.24%), Paraguayan (12.0%, a difference of 0.26%), and Immigrants from Croatia (12.0%, a difference of 0.27%).
| Demographics | Rating | Rank | Female Poverty Among 25-34 Year Olds |
| Koreans | 99.6 /100 | #47 | Exceptional 12.0% |
| Immigrants | Belarus | 99.6 /100 | #48 | Exceptional 12.0% |
| Immigrants | Egypt | 99.6 /100 | #49 | Exceptional 12.0% |
| Immigrants | Croatia | 99.6 /100 | #50 | Exceptional 12.0% |
| Paraguayans | 99.6 /100 | #51 | Exceptional 12.0% |
| Immigrants | Eastern Europe | 99.6 /100 | #52 | Exceptional 12.0% |
| Immigrants | Israel | 99.6 /100 | #53 | Exceptional 12.0% |
| Eastern Europeans | 99.6 /100 | #54 | Exceptional 12.0% |
| Immigrants | Philippines | 99.5 /100 | #55 | Exceptional 12.0% |
| Luxembourgers | 99.5 /100 | #56 | Exceptional 12.1% |
| Jordanians | 99.4 /100 | #57 | Exceptional 12.1% |
| Immigrants | Romania | 99.4 /100 | #58 | Exceptional 12.1% |
| Russians | 99.4 /100 | #59 | Exceptional 12.1% |
| Immigrants | Northern Europe | 99.4 /100 | #60 | Exceptional 12.1% |
| Immigrants | Czechoslovakia | 99.4 /100 | #61 | Exceptional 12.1% |
Demographics Similar to Alaskan Athabascans by Female Poverty Among 25-34 Year Olds
In terms of female poverty among 25-34 year olds, the demographic groups most similar to Alaskan Athabascans are Cheyenne (19.1%, a difference of 0.080%), Creek (19.2%, a difference of 0.25%), Black/African American (18.9%, a difference of 1.0%), Paiute (19.6%, a difference of 2.5%), and Kiowa (19.7%, a difference of 2.9%).
| Demographics | Rating | Rank | Female Poverty Among 25-34 Year Olds |
| Choctaw | 0.0 /100 | #321 | Tragic 18.1% |
| Central American Indians | 0.0 /100 | #322 | Tragic 18.2% |
| Seminole | 0.0 /100 | #323 | Tragic 18.3% |
| Dutch West Indians | 0.0 /100 | #324 | Tragic 18.4% |
| Inupiat | 0.0 /100 | #325 | Tragic 18.5% |
| Blacks/African Americans | 0.0 /100 | #326 | Tragic 18.9% |
| Cheyenne | 0.0 /100 | #327 | Tragic 19.1% |
| Alaskan Athabascans | 0.0 /100 | #328 | Tragic 19.1% |
| Creek | 0.0 /100 | #329 | Tragic 19.2% |
| Paiute | 0.0 /100 | #330 | Tragic 19.6% |
| Kiowa | 0.0 /100 | #331 | Tragic 19.7% |
| Immigrants | Yemen | 0.0 /100 | #332 | Tragic 19.8% |
| Cajuns | 0.0 /100 | #333 | Tragic 19.9% |
| Apache | 0.0 /100 | #334 | Tragic 20.1% |
| Natives/Alaskans | 0.0 /100 | #335 | Tragic 20.3% |