French American Indian vs Colombian Female Poverty Among 25-34 Year Olds
COMPARE
French American Indian
Colombian
Female Poverty Among 25-34 Year Olds
Female Poverty Among 25-34 Year Olds Comparison
French American Indians
Colombians
15.9%
FEMALE POVERTY AMONG 25-34 YEAR OLDS
0.0/ 100
METRIC RATING
278th/ 347
METRIC RANK
13.2%
FEMALE POVERTY AMONG 25-34 YEAR OLDS
77.2/ 100
METRIC RATING
145th/ 347
METRIC RANK
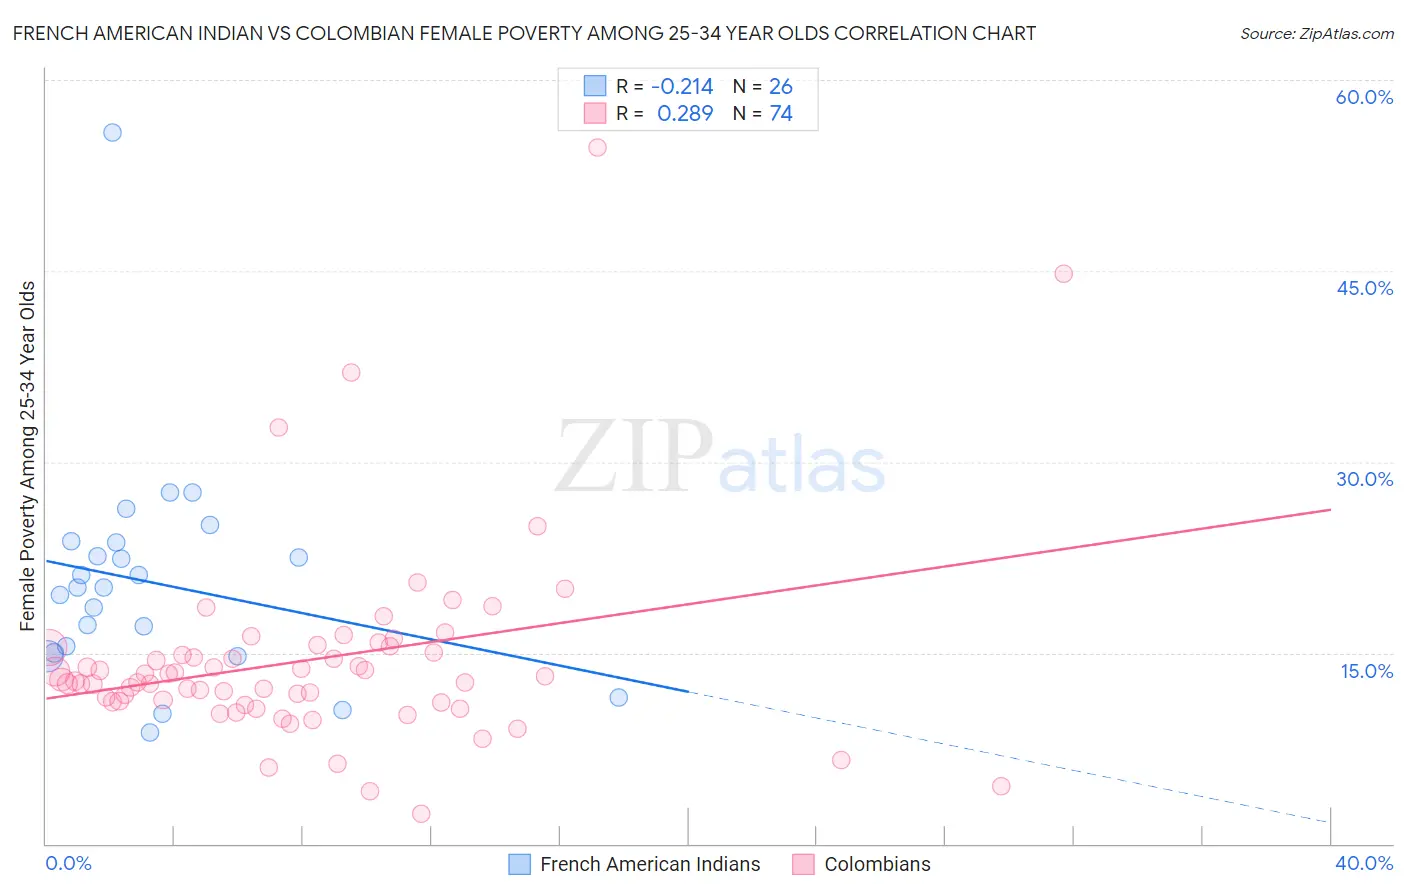
French American Indian vs Colombian Female Poverty Among 25-34 Year Olds Correlation Chart
The statistical analysis conducted on geographies consisting of 131,099,782 people shows a weak negative correlation between the proportion of French American Indians and poverty level among females between the ages 25 and 34 in the United States with a correlation coefficient (R) of -0.214 and weighted average of 15.9%. Similarly, the statistical analysis conducted on geographies consisting of 412,698,709 people shows a weak positive correlation between the proportion of Colombians and poverty level among females between the ages 25 and 34 in the United States with a correlation coefficient (R) of 0.289 and weighted average of 13.2%, a difference of 20.4%.
Female Poverty Among 25-34 Year Olds Correlation Summary
| Measurement | French American Indian | Colombian |
| Minimum | 8.8% | 2.4% |
| Maximum | 55.9% | 54.7% |
| Range | 47.1% | 52.3% |
| Mean | 20.5% | 14.4% |
| Median | 20.1% | 12.8% |
| Interquartile 25% (IQ1) | 15.0% | 11.2% |
| Interquartile 75% (IQ3) | 23.6% | 15.4% |
| Interquartile Range (IQR) | 8.7% | 4.2% |
| Standard Deviation (Sample) | 9.0% | 7.9% |
| Standard Deviation (Population) | 8.8% | 7.9% |
Similar Demographics by Female Poverty Among 25-34 Year Olds
Demographics Similar to French American Indians by Female Poverty Among 25-34 Year Olds
In terms of female poverty among 25-34 year olds, the demographic groups most similar to French American Indians are Fijian (15.9%, a difference of 0.0%), Bangladeshi (15.9%, a difference of 0.16%), Immigrants from Micronesia (15.8%, a difference of 0.29%), Immigrants from Zaire (15.8%, a difference of 0.30%), and Immigrants from Latin America (16.0%, a difference of 0.67%).
| Demographics | Rating | Rank | Female Poverty Among 25-34 Year Olds |
| Cree | 0.1 /100 | #271 | Tragic 15.6% |
| Senegalese | 0.1 /100 | #272 | Tragic 15.6% |
| Immigrants | Nonimmigrants | 0.1 /100 | #273 | Tragic 15.6% |
| Immigrants | Caribbean | 0.0 /100 | #274 | Tragic 15.7% |
| Immigrants | Azores | 0.0 /100 | #275 | Tragic 15.8% |
| Immigrants | Zaire | 0.0 /100 | #276 | Tragic 15.8% |
| Immigrants | Micronesia | 0.0 /100 | #277 | Tragic 15.8% |
| French American Indians | 0.0 /100 | #278 | Tragic 15.9% |
| Fijians | 0.0 /100 | #279 | Tragic 15.9% |
| Bangladeshis | 0.0 /100 | #280 | Tragic 15.9% |
| Immigrants | Latin America | 0.0 /100 | #281 | Tragic 16.0% |
| Aleuts | 0.0 /100 | #282 | Tragic 16.1% |
| Bahamians | 0.0 /100 | #283 | Tragic 16.1% |
| Shoshone | 0.0 /100 | #284 | Tragic 16.2% |
| Immigrants | Bahamas | 0.0 /100 | #285 | Tragic 16.3% |
Demographics Similar to Colombians by Female Poverty Among 25-34 Year Olds
In terms of female poverty among 25-34 year olds, the demographic groups most similar to Colombians are South American (13.2%, a difference of 0.040%), European (13.2%, a difference of 0.050%), Lebanese (13.2%, a difference of 0.050%), Sierra Leonean (13.2%, a difference of 0.11%), and Iraqi (13.2%, a difference of 0.14%).
| Demographics | Rating | Rank | Female Poverty Among 25-34 Year Olds |
| Brazilians | 84.5 /100 | #138 | Excellent 13.1% |
| Austrians | 83.7 /100 | #139 | Excellent 13.1% |
| Immigrants | Iraq | 83.6 /100 | #140 | Excellent 13.1% |
| New Zealanders | 83.4 /100 | #141 | Excellent 13.1% |
| Scandinavians | 82.3 /100 | #142 | Excellent 13.1% |
| Israelis | 81.9 /100 | #143 | Excellent 13.1% |
| Native Hawaiians | 78.9 /100 | #144 | Good 13.2% |
| Colombians | 77.2 /100 | #145 | Good 13.2% |
| South Americans | 76.9 /100 | #146 | Good 13.2% |
| Europeans | 76.8 /100 | #147 | Good 13.2% |
| Lebanese | 76.8 /100 | #148 | Good 13.2% |
| Sierra Leoneans | 76.3 /100 | #149 | Good 13.2% |
| Iraqis | 76.0 /100 | #150 | Good 13.2% |
| Costa Ricans | 75.8 /100 | #151 | Good 13.2% |
| Slavs | 75.7 /100 | #152 | Good 13.2% |