Trinidadian and Tobagonian vs Alaskan Athabascan Female Poverty Among 25-34 Year Olds
COMPARE
Trinidadian and Tobagonian
Alaskan Athabascan
Female Poverty Among 25-34 Year Olds
Female Poverty Among 25-34 Year Olds Comparison
Trinidadians and Tobagonians
Alaskan Athabascans
14.2%
FEMALE POVERTY AMONG 25-34 YEAR OLDS
8.2/ 100
METRIC RATING
211th/ 347
METRIC RANK
19.1%
FEMALE POVERTY AMONG 25-34 YEAR OLDS
0.0/ 100
METRIC RATING
328th/ 347
METRIC RANK
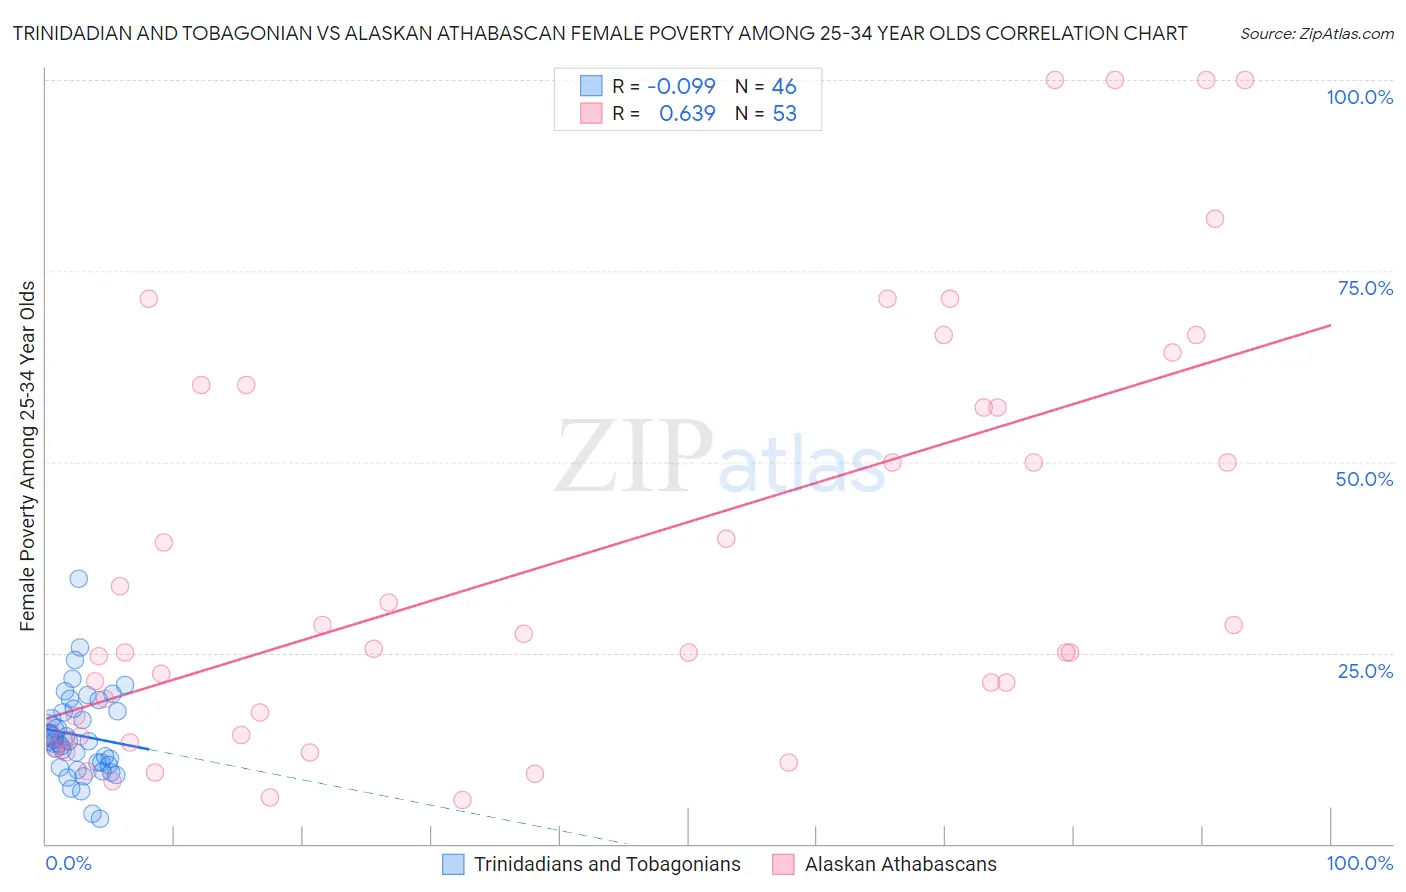
Trinidadian and Tobagonian vs Alaskan Athabascan Female Poverty Among 25-34 Year Olds Correlation Chart
The statistical analysis conducted on geographies consisting of 217,790,288 people shows a slight negative correlation between the proportion of Trinidadians and Tobagonians and poverty level among females between the ages 25 and 34 in the United States with a correlation coefficient (R) of -0.099 and weighted average of 14.2%. Similarly, the statistical analysis conducted on geographies consisting of 45,660,440 people shows a significant positive correlation between the proportion of Alaskan Athabascans and poverty level among females between the ages 25 and 34 in the United States with a correlation coefficient (R) of 0.639 and weighted average of 19.1%, a difference of 34.4%.
Female Poverty Among 25-34 Year Olds Correlation Summary
| Measurement | Trinidadian and Tobagonian | Alaskan Athabascan |
| Minimum | 3.3% | 5.7% |
| Maximum | 34.7% | 100.0% |
| Range | 31.4% | 94.3% |
| Mean | 14.2% | 37.0% |
| Median | 13.5% | 25.0% |
| Interquartile 25% (IQ1) | 10.3% | 14.2% |
| Interquartile 75% (IQ3) | 17.3% | 58.6% |
| Interquartile Range (IQR) | 7.0% | 44.4% |
| Standard Deviation (Sample) | 5.8% | 27.7% |
| Standard Deviation (Population) | 5.7% | 27.4% |
Similar Demographics by Female Poverty Among 25-34 Year Olds
Demographics Similar to Trinidadians and Tobagonians by Female Poverty Among 25-34 Year Olds
In terms of female poverty among 25-34 year olds, the demographic groups most similar to Trinidadians and Tobagonians are Guyanese (14.2%, a difference of 0.12%), Panamanian (14.2%, a difference of 0.12%), Immigrants from Guyana (14.3%, a difference of 0.45%), Puget Sound Salish (14.3%, a difference of 0.48%), and French (14.3%, a difference of 0.58%).
| Demographics | Rating | Rank | Female Poverty Among 25-34 Year Olds |
| Hawaiians | 13.6 /100 | #204 | Poor 14.1% |
| Immigrants | Africa | 13.4 /100 | #205 | Poor 14.1% |
| Hungarians | 11.8 /100 | #206 | Poor 14.1% |
| Japanese | 11.7 /100 | #207 | Poor 14.1% |
| Immigrants | Panama | 11.6 /100 | #208 | Poor 14.1% |
| Guyanese | 8.6 /100 | #209 | Tragic 14.2% |
| Panamanians | 8.6 /100 | #210 | Tragic 14.2% |
| Trinidadians and Tobagonians | 8.2 /100 | #211 | Tragic 14.2% |
| Immigrants | Guyana | 6.6 /100 | #212 | Tragic 14.3% |
| Puget Sound Salish | 6.5 /100 | #213 | Tragic 14.3% |
| French | 6.2 /100 | #214 | Tragic 14.3% |
| Immigrants | Nigeria | 6.2 /100 | #215 | Tragic 14.3% |
| French Canadians | 5.5 /100 | #216 | Tragic 14.3% |
| Spanish American Indians | 5.5 /100 | #217 | Tragic 14.3% |
| Immigrants | Thailand | 5.2 /100 | #218 | Tragic 14.3% |
Demographics Similar to Alaskan Athabascans by Female Poverty Among 25-34 Year Olds
In terms of female poverty among 25-34 year olds, the demographic groups most similar to Alaskan Athabascans are Cheyenne (19.1%, a difference of 0.080%), Creek (19.2%, a difference of 0.25%), Black/African American (18.9%, a difference of 1.0%), Paiute (19.6%, a difference of 2.5%), and Kiowa (19.7%, a difference of 2.9%).
| Demographics | Rating | Rank | Female Poverty Among 25-34 Year Olds |
| Choctaw | 0.0 /100 | #321 | Tragic 18.1% |
| Central American Indians | 0.0 /100 | #322 | Tragic 18.2% |
| Seminole | 0.0 /100 | #323 | Tragic 18.3% |
| Dutch West Indians | 0.0 /100 | #324 | Tragic 18.4% |
| Inupiat | 0.0 /100 | #325 | Tragic 18.5% |
| Blacks/African Americans | 0.0 /100 | #326 | Tragic 18.9% |
| Cheyenne | 0.0 /100 | #327 | Tragic 19.1% |
| Alaskan Athabascans | 0.0 /100 | #328 | Tragic 19.1% |
| Creek | 0.0 /100 | #329 | Tragic 19.2% |
| Paiute | 0.0 /100 | #330 | Tragic 19.6% |
| Kiowa | 0.0 /100 | #331 | Tragic 19.7% |
| Immigrants | Yemen | 0.0 /100 | #332 | Tragic 19.8% |
| Cajuns | 0.0 /100 | #333 | Tragic 19.9% |
| Apache | 0.0 /100 | #334 | Tragic 20.1% |
| Natives/Alaskans | 0.0 /100 | #335 | Tragic 20.3% |