French American Indian vs Alaskan Athabascan Child Poverty Among Girls Under 16
COMPARE
French American Indian
Alaskan Athabascan
Child Poverty Among Girls Under 16
Child Poverty Among Girls Under 16 Comparison
French American Indians
Alaskan Athabascans
19.2%
CHILD POVERTY AMONG GIRLS UNDER 16
0.3/ 100
METRIC RATING
248th/ 347
METRIC RANK
18.3%
CHILD POVERTY AMONG GIRLS UNDER 16
2.0/ 100
METRIC RATING
228th/ 347
METRIC RANK
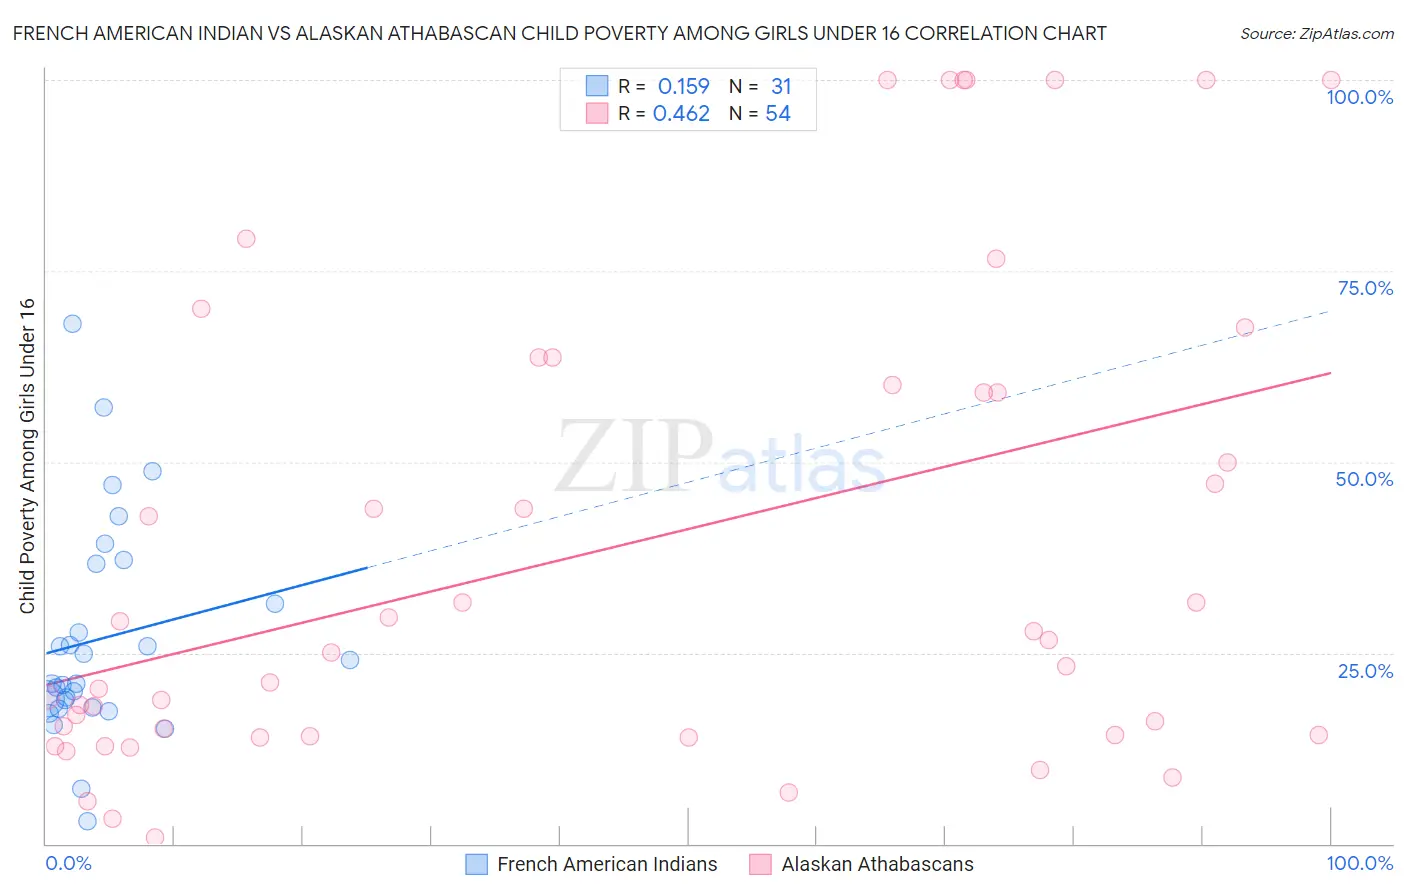
French American Indian vs Alaskan Athabascan Child Poverty Among Girls Under 16 Correlation Chart
The statistical analysis conducted on geographies consisting of 131,073,161 people shows a poor positive correlation between the proportion of French American Indians and poverty level among girls under the age of 16 in the United States with a correlation coefficient (R) of 0.159 and weighted average of 19.2%. Similarly, the statistical analysis conducted on geographies consisting of 45,659,111 people shows a moderate positive correlation between the proportion of Alaskan Athabascans and poverty level among girls under the age of 16 in the United States with a correlation coefficient (R) of 0.462 and weighted average of 18.3%, a difference of 4.8%.
Child Poverty Among Girls Under 16 Correlation Summary
| Measurement | French American Indian | Alaskan Athabascan |
| Minimum | 3.0% | 0.83% |
| Maximum | 68.1% | 100.0% |
| Range | 65.1% | 99.2% |
| Mean | 26.9% | 38.6% |
| Median | 21.0% | 25.8% |
| Interquartile 25% (IQ1) | 17.8% | 14.3% |
| Interquartile 75% (IQ3) | 36.7% | 60.0% |
| Interquartile Range (IQR) | 18.9% | 45.7% |
| Standard Deviation (Sample) | 14.3% | 31.2% |
| Standard Deviation (Population) | 14.0% | 30.9% |
Demographics Similar to French American Indians and Alaskan Athabascans by Child Poverty Among Girls Under 16
In terms of child poverty among girls under 16, the demographic groups most similar to French American Indians are Immigrants from Ghana (18.9%, a difference of 1.4%), Immigrants from Laos (18.9%, a difference of 1.8%), Shoshone (18.9%, a difference of 1.8%), Ecuadorian (18.8%, a difference of 1.9%), and Immigrants from Nicaragua (18.8%, a difference of 2.0%). Similarly, the demographic groups most similar to Alaskan Athabascans are Ghanaian (18.5%, a difference of 0.91%), Osage (18.5%, a difference of 1.1%), Cree (18.5%, a difference of 1.2%), Immigrants from Sudan (18.6%, a difference of 1.4%), and Sudanese (18.6%, a difference of 1.5%).
| Demographics | Rating | Rank | Child Poverty Among Girls Under 16 |
| Alaskan Athabascans | 2.0 /100 | #228 | Tragic 18.3% |
| Ghanaians | 1.4 /100 | #229 | Tragic 18.5% |
| Osage | 1.3 /100 | #230 | Tragic 18.5% |
| Cree | 1.3 /100 | #231 | Tragic 18.5% |
| Immigrants | Sudan | 1.1 /100 | #232 | Tragic 18.6% |
| Sudanese | 1.1 /100 | #233 | Tragic 18.6% |
| Fijians | 1.1 /100 | #234 | Tragic 18.6% |
| Nepalese | 1.1 /100 | #235 | Tragic 18.6% |
| Alsatians | 1.1 /100 | #236 | Tragic 18.6% |
| Immigrants | Nigeria | 1.0 /100 | #237 | Tragic 18.6% |
| Immigrants | Eritrea | 1.0 /100 | #238 | Tragic 18.7% |
| Marshallese | 0.9 /100 | #239 | Tragic 18.7% |
| Nigerians | 0.9 /100 | #240 | Tragic 18.7% |
| Americans | 0.8 /100 | #241 | Tragic 18.8% |
| Immigrants | Cuba | 0.7 /100 | #242 | Tragic 18.8% |
| Immigrants | Nicaragua | 0.7 /100 | #243 | Tragic 18.8% |
| Ecuadorians | 0.7 /100 | #244 | Tragic 18.8% |
| Shoshone | 0.6 /100 | #245 | Tragic 18.9% |
| Immigrants | Laos | 0.6 /100 | #246 | Tragic 18.9% |
| Immigrants | Ghana | 0.5 /100 | #247 | Tragic 18.9% |
| French American Indians | 0.3 /100 | #248 | Tragic 19.2% |