Finnish vs Immigrants from Western Europe Single Female Poverty
COMPARE
Finnish
Immigrants from Western Europe
Single Female Poverty
Single Female Poverty Comparison
Finns
Immigrants from Western Europe
21.5%
SINGLE FEMALE POVERTY
16.2/ 100
METRIC RATING
205th/ 347
METRIC RANK
20.6%
SINGLE FEMALE POVERTY
76.7/ 100
METRIC RATING
154th/ 347
METRIC RANK
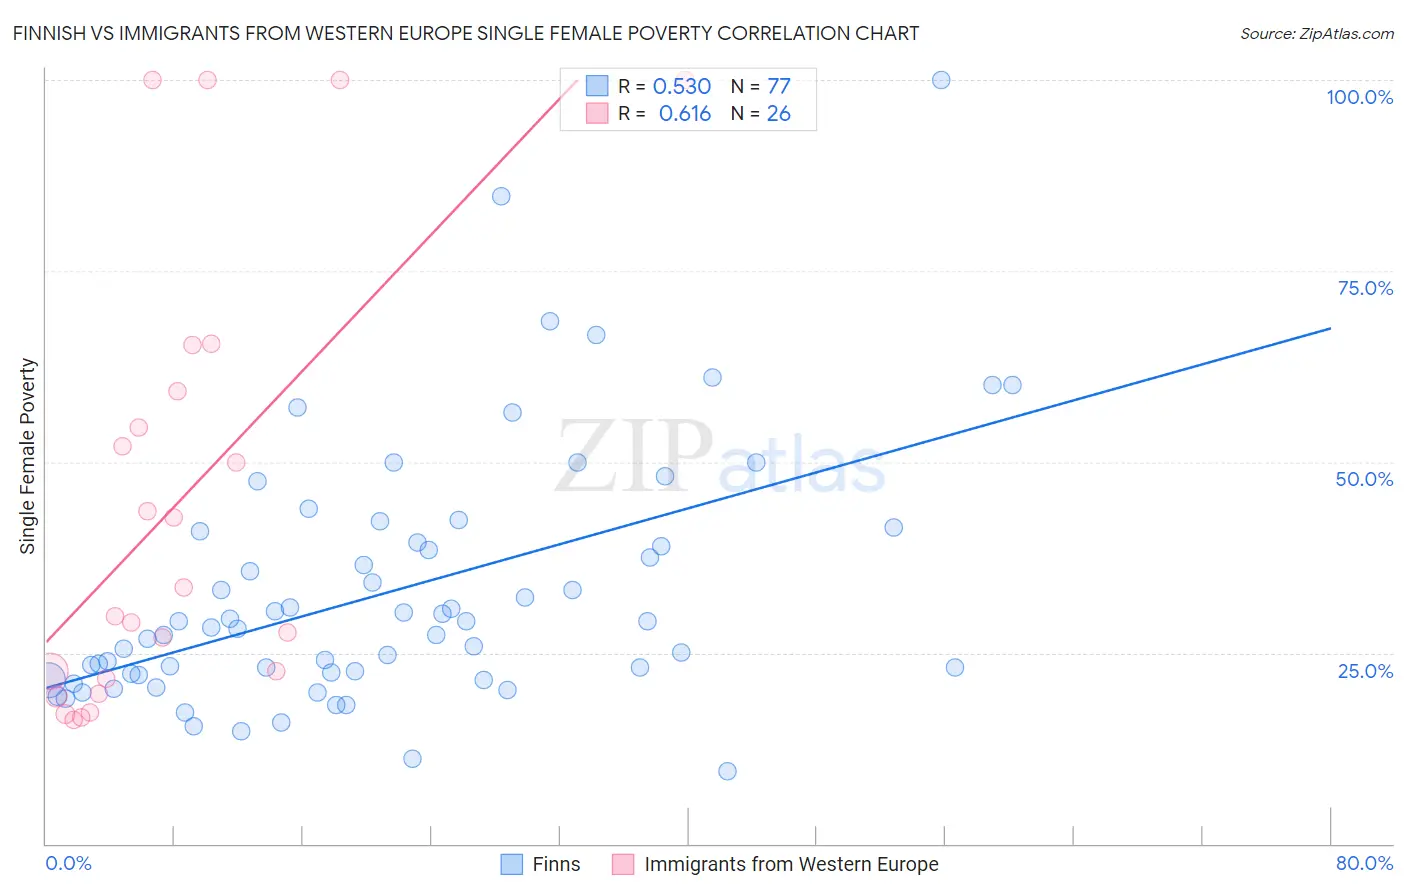
Finnish vs Immigrants from Western Europe Single Female Poverty Correlation Chart
The statistical analysis conducted on geographies consisting of 396,433,043 people shows a substantial positive correlation between the proportion of Finns and poverty level among single females in the United States with a correlation coefficient (R) of 0.530 and weighted average of 21.5%. Similarly, the statistical analysis conducted on geographies consisting of 482,241,585 people shows a significant positive correlation between the proportion of Immigrants from Western Europe and poverty level among single females in the United States with a correlation coefficient (R) of 0.616 and weighted average of 20.6%, a difference of 4.5%.
Single Female Poverty Correlation Summary
| Measurement | Finnish | Immigrants from Western Europe |
| Minimum | 9.5% | 16.2% |
| Maximum | 100.0% | 100.0% |
| Range | 90.5% | 83.8% |
| Mean | 33.0% | 44.3% |
| Median | 28.4% | 31.6% |
| Interquartile 25% (IQ1) | 22.2% | 21.6% |
| Interquartile 75% (IQ3) | 40.2% | 59.2% |
| Interquartile Range (IQR) | 18.0% | 37.6% |
| Standard Deviation (Sample) | 16.5% | 28.7% |
| Standard Deviation (Population) | 16.4% | 28.2% |
Similar Demographics by Single Female Poverty
Demographics Similar to Finns by Single Female Poverty
In terms of single female poverty, the demographic groups most similar to Finns are Belgian (21.5%, a difference of 0.020%), Ghanaian (21.6%, a difference of 0.050%), Immigrants from Africa (21.5%, a difference of 0.060%), Haitian (21.6%, a difference of 0.090%), and Immigrants from Eastern Africa (21.6%, a difference of 0.12%).
| Demographics | Rating | Rank | Single Female Poverty |
| Swiss | 24.2 /100 | #198 | Fair 21.4% |
| Immigrants | Immigrants | 22.0 /100 | #199 | Fair 21.4% |
| Irish | 21.4 /100 | #200 | Fair 21.4% |
| Nigerians | 20.9 /100 | #201 | Fair 21.4% |
| Immigrants | Kenya | 20.7 /100 | #202 | Fair 21.4% |
| Immigrants | Haiti | 18.8 /100 | #203 | Poor 21.5% |
| Immigrants | Africa | 16.7 /100 | #204 | Poor 21.5% |
| Finns | 16.2 /100 | #205 | Poor 21.5% |
| Belgians | 16.1 /100 | #206 | Poor 21.5% |
| Ghanaians | 15.7 /100 | #207 | Poor 21.6% |
| Haitians | 15.4 /100 | #208 | Poor 21.6% |
| Immigrants | Eastern Africa | 15.1 /100 | #209 | Poor 21.6% |
| Immigrants | Panama | 14.4 /100 | #210 | Poor 21.6% |
| Icelanders | 14.0 /100 | #211 | Poor 21.6% |
| Jamaicans | 14.0 /100 | #212 | Poor 21.6% |
Demographics Similar to Immigrants from Western Europe by Single Female Poverty
In terms of single female poverty, the demographic groups most similar to Immigrants from Western Europe are Swedish (20.6%, a difference of 0.030%), Samoan (20.6%, a difference of 0.060%), Immigrants from Uruguay (20.6%, a difference of 0.080%), South American Indian (20.6%, a difference of 0.10%), and Immigrants from Oceania (20.7%, a difference of 0.21%).
| Demographics | Rating | Rank | Single Female Poverty |
| South Africans | 85.3 /100 | #147 | Excellent 20.4% |
| Luxembourgers | 84.9 /100 | #148 | Excellent 20.4% |
| Portuguese | 81.5 /100 | #149 | Excellent 20.5% |
| Immigrants | Denmark | 80.5 /100 | #150 | Excellent 20.5% |
| Puget Sound Salish | 79.6 /100 | #151 | Good 20.6% |
| Immigrants | Uruguay | 77.7 /100 | #152 | Good 20.6% |
| Swedes | 77.1 /100 | #153 | Good 20.6% |
| Immigrants | Western Europe | 76.7 /100 | #154 | Good 20.6% |
| Samoans | 76.0 /100 | #155 | Good 20.6% |
| South American Indians | 75.7 /100 | #156 | Good 20.6% |
| Immigrants | Oceania | 74.3 /100 | #157 | Good 20.7% |
| Danes | 73.0 /100 | #158 | Good 20.7% |
| Costa Ricans | 71.8 /100 | #159 | Good 20.7% |
| Arabs | 70.8 /100 | #160 | Good 20.7% |
| Kenyans | 68.5 /100 | #161 | Good 20.8% |