Filipino vs Immigrants from Asia Female Poverty
COMPARE
Filipino
Immigrants from Asia
Female Poverty
Female Poverty Comparison
Filipinos
Immigrants from Asia
10.9%
FEMALE POVERTY
100.0/ 100
METRIC RATING
5th/ 347
METRIC RANK
12.2%
FEMALE POVERTY
98.1/ 100
METRIC RATING
61st/ 347
METRIC RANK
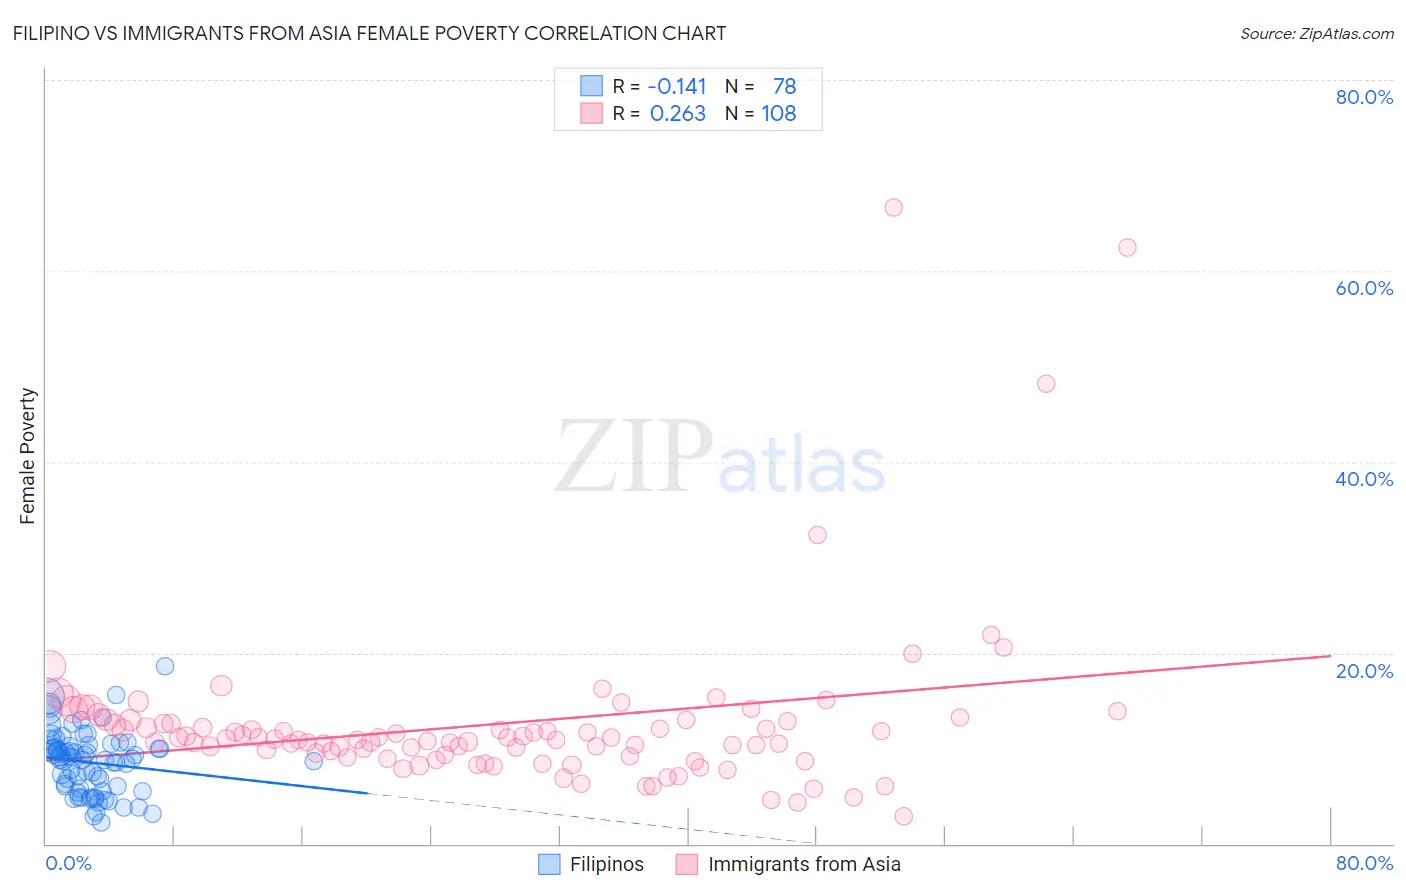
Filipino vs Immigrants from Asia Female Poverty Correlation Chart
The statistical analysis conducted on geographies consisting of 254,106,597 people shows a poor negative correlation between the proportion of Filipinos and poverty level among females in the United States with a correlation coefficient (R) of -0.141 and weighted average of 10.9%. Similarly, the statistical analysis conducted on geographies consisting of 548,172,468 people shows a weak positive correlation between the proportion of Immigrants from Asia and poverty level among females in the United States with a correlation coefficient (R) of 0.263 and weighted average of 12.2%, a difference of 11.2%.
Female Poverty Correlation Summary
| Measurement | Filipino | Immigrants from Asia |
| Minimum | 2.2% | 2.9% |
| Maximum | 18.6% | 66.7% |
| Range | 16.4% | 63.7% |
| Mean | 8.5% | 12.5% |
| Median | 8.9% | 10.9% |
| Interquartile 25% (IQ1) | 5.7% | 9.2% |
| Interquartile 75% (IQ3) | 10.2% | 12.7% |
| Interquartile Range (IQR) | 4.4% | 3.5% |
| Standard Deviation (Sample) | 3.3% | 8.9% |
| Standard Deviation (Population) | 3.2% | 8.8% |
Similar Demographics by Female Poverty
Demographics Similar to Filipinos by Female Poverty
In terms of female poverty, the demographic groups most similar to Filipinos are Immigrants from Ireland (11.0%, a difference of 0.38%), Assyrian/Chaldean/Syriac (11.0%, a difference of 0.75%), Immigrants from South Central Asia (11.1%, a difference of 1.5%), Bulgarian (11.1%, a difference of 1.7%), and Immigrants from Hong Kong (11.2%, a difference of 2.5%).
| Demographics | Rating | Rank | Female Poverty |
| Immigrants | India | 100.0 /100 | #1 | Exceptional 9.9% |
| Chinese | 100.0 /100 | #2 | Exceptional 10.4% |
| Thais | 100.0 /100 | #3 | Exceptional 10.5% |
| Immigrants | Taiwan | 100.0 /100 | #4 | Exceptional 10.5% |
| Filipinos | 100.0 /100 | #5 | Exceptional 10.9% |
| Immigrants | Ireland | 99.9 /100 | #6 | Exceptional 11.0% |
| Assyrians/Chaldeans/Syriacs | 99.9 /100 | #7 | Exceptional 11.0% |
| Immigrants | South Central Asia | 99.9 /100 | #8 | Exceptional 11.1% |
| Bulgarians | 99.9 /100 | #9 | Exceptional 11.1% |
| Immigrants | Hong Kong | 99.9 /100 | #10 | Exceptional 11.2% |
| Maltese | 99.9 /100 | #11 | Exceptional 11.2% |
| Bhutanese | 99.9 /100 | #12 | Exceptional 11.3% |
| Immigrants | Lithuania | 99.9 /100 | #13 | Exceptional 11.3% |
| Lithuanians | 99.8 /100 | #14 | Exceptional 11.4% |
| Latvians | 99.8 /100 | #15 | Exceptional 11.4% |
Demographics Similar to Immigrants from Asia by Female Poverty
In terms of female poverty, the demographic groups most similar to Immigrants from Asia are Immigrants from Australia (12.2%, a difference of 0.0%), Immigrants from Italy (12.2%, a difference of 0.020%), Ukrainian (12.2%, a difference of 0.10%), German (12.2%, a difference of 0.13%), and Indian (Asian) (12.2%, a difference of 0.16%).
| Demographics | Rating | Rank | Female Poverty |
| Immigrants | Philippines | 98.7 /100 | #54 | Exceptional 12.1% |
| Immigrants | Sri Lanka | 98.5 /100 | #55 | Exceptional 12.1% |
| Estonians | 98.3 /100 | #56 | Exceptional 12.1% |
| Immigrants | Serbia | 98.3 /100 | #57 | Exceptional 12.1% |
| Scandinavians | 98.2 /100 | #58 | Exceptional 12.1% |
| Immigrants | Europe | 98.2 /100 | #59 | Exceptional 12.1% |
| Immigrants | Australia | 98.1 /100 | #60 | Exceptional 12.2% |
| Immigrants | Asia | 98.1 /100 | #61 | Exceptional 12.2% |
| Immigrants | Italy | 98.0 /100 | #62 | Exceptional 12.2% |
| Ukrainians | 98.0 /100 | #63 | Exceptional 12.2% |
| Germans | 98.0 /100 | #64 | Exceptional 12.2% |
| Indians (Asian) | 97.9 /100 | #65 | Exceptional 12.2% |
| Austrians | 97.9 /100 | #66 | Exceptional 12.2% |
| Immigrants | Eastern Asia | 97.8 /100 | #67 | Exceptional 12.2% |
| Immigrants | Netherlands | 97.8 /100 | #68 | Exceptional 12.2% |