British West Indian vs Soviet Union Poverty
COMPARE
British West Indian
Soviet Union
Poverty
Poverty Comparison
British West Indians
Soviet Union
15.9%
POVERTY
0.0/ 100
METRIC RATING
315th/ 347
METRIC RANK
11.7%
POVERTY
88.4/ 100
METRIC RATING
124th/ 347
METRIC RANK
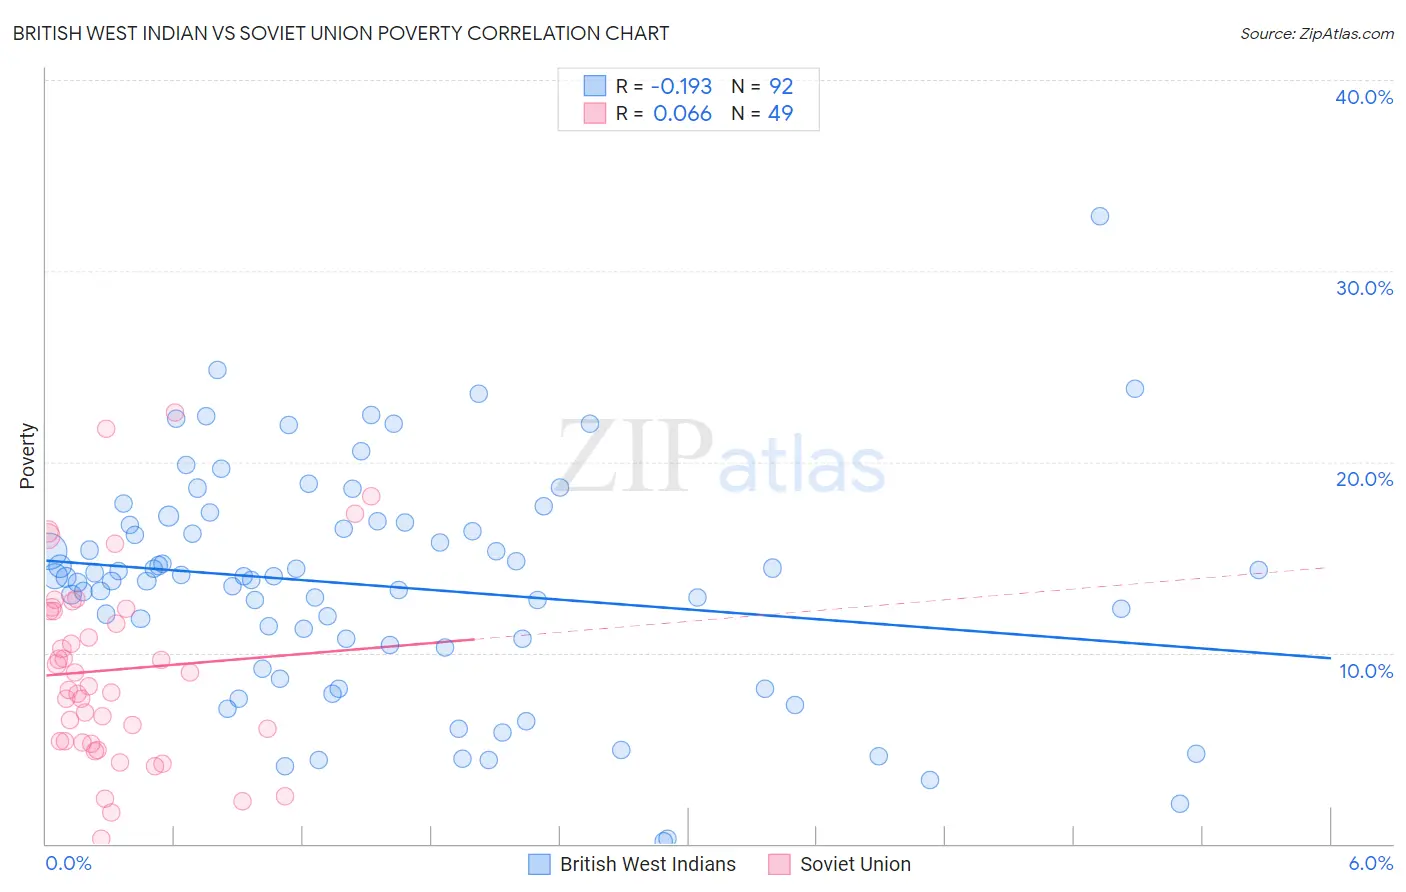
British West Indian vs Soviet Union Poverty Correlation Chart
The statistical analysis conducted on geographies consisting of 152,630,673 people shows a poor negative correlation between the proportion of British West Indians and poverty level in the United States with a correlation coefficient (R) of -0.193 and weighted average of 15.9%. Similarly, the statistical analysis conducted on geographies consisting of 43,449,399 people shows a slight positive correlation between the proportion of Soviet Union and poverty level in the United States with a correlation coefficient (R) of 0.066 and weighted average of 11.7%, a difference of 35.4%.
Poverty Correlation Summary
| Measurement | British West Indian | Soviet Union |
| Minimum | 0.13% | 0.29% |
| Maximum | 32.9% | 22.6% |
| Range | 32.8% | 22.3% |
| Mean | 13.5% | 9.1% |
| Median | 14.0% | 8.3% |
| Interquartile 25% (IQ1) | 10.3% | 5.3% |
| Interquartile 75% (IQ3) | 16.8% | 12.3% |
| Interquartile Range (IQR) | 6.4% | 6.9% |
| Standard Deviation (Sample) | 5.9% | 5.0% |
| Standard Deviation (Population) | 5.9% | 5.0% |
Similar Demographics by Poverty
Demographics Similar to British West Indians by Poverty
In terms of poverty, the demographic groups most similar to British West Indians are Honduran (15.9%, a difference of 0.0%), Immigrants from Somalia (15.8%, a difference of 0.37%), Immigrants from Grenada (15.8%, a difference of 0.49%), Cajun (15.7%, a difference of 0.93%), and Chippewa (15.7%, a difference of 1.1%).
| Demographics | Rating | Rank | Poverty |
| Choctaw | 0.0 /100 | #308 | Tragic 15.6% |
| Seminole | 0.0 /100 | #309 | Tragic 15.6% |
| Dutch West Indians | 0.0 /100 | #310 | Tragic 15.6% |
| Chippewa | 0.0 /100 | #311 | Tragic 15.7% |
| Cajuns | 0.0 /100 | #312 | Tragic 15.7% |
| Immigrants | Grenada | 0.0 /100 | #313 | Tragic 15.8% |
| Immigrants | Somalia | 0.0 /100 | #314 | Tragic 15.8% |
| British West Indians | 0.0 /100 | #315 | Tragic 15.9% |
| Hondurans | 0.0 /100 | #316 | Tragic 15.9% |
| U.S. Virgin Islanders | 0.0 /100 | #317 | Tragic 16.1% |
| Immigrants | Dominica | 0.0 /100 | #318 | Tragic 16.1% |
| Immigrants | Congo | 0.0 /100 | #319 | Tragic 16.1% |
| Immigrants | Honduras | 0.0 /100 | #320 | Tragic 16.2% |
| Arapaho | 0.0 /100 | #321 | Tragic 16.3% |
| Menominee | 0.0 /100 | #322 | Tragic 16.4% |
Demographics Similar to Soviet Union by Poverty
In terms of poverty, the demographic groups most similar to Soviet Union are Immigrants from Brazil (11.7%, a difference of 0.040%), Immigrants from Hungary (11.7%, a difference of 0.070%), Immigrants from Norway (11.7%, a difference of 0.080%), New Zealander (11.7%, a difference of 0.090%), and Puget Sound Salish (11.7%, a difference of 0.090%).
| Demographics | Rating | Rank | Poverty |
| Sri Lankans | 89.4 /100 | #117 | Excellent 11.7% |
| Argentineans | 89.1 /100 | #118 | Excellent 11.7% |
| Tlingit-Haida | 89.0 /100 | #119 | Excellent 11.7% |
| Immigrants | South Eastern Asia | 88.9 /100 | #120 | Excellent 11.7% |
| New Zealanders | 88.7 /100 | #121 | Excellent 11.7% |
| Puget Sound Salish | 88.7 /100 | #122 | Excellent 11.7% |
| Immigrants | Hungary | 88.6 /100 | #123 | Excellent 11.7% |
| Soviet Union | 88.4 /100 | #124 | Excellent 11.7% |
| Immigrants | Brazil | 88.2 /100 | #125 | Excellent 11.7% |
| Immigrants | Norway | 88.0 /100 | #126 | Excellent 11.7% |
| Immigrants | Argentina | 88.0 /100 | #127 | Excellent 11.7% |
| Immigrants | Israel | 87.4 /100 | #128 | Excellent 11.7% |
| South Africans | 87.0 /100 | #129 | Excellent 11.7% |
| Immigrants | Ukraine | 86.6 /100 | #130 | Excellent 11.8% |
| French | 86.1 /100 | #131 | Excellent 11.8% |