Immigrants from Barbados vs Soviet Union Poverty
COMPARE
Immigrants from Barbados
Soviet Union
Poverty
Poverty Comparison
Immigrants from Barbados
Soviet Union
14.9%
POVERTY
0.0/ 100
METRIC RATING
281st/ 347
METRIC RANK
11.7%
POVERTY
88.4/ 100
METRIC RATING
124th/ 347
METRIC RANK
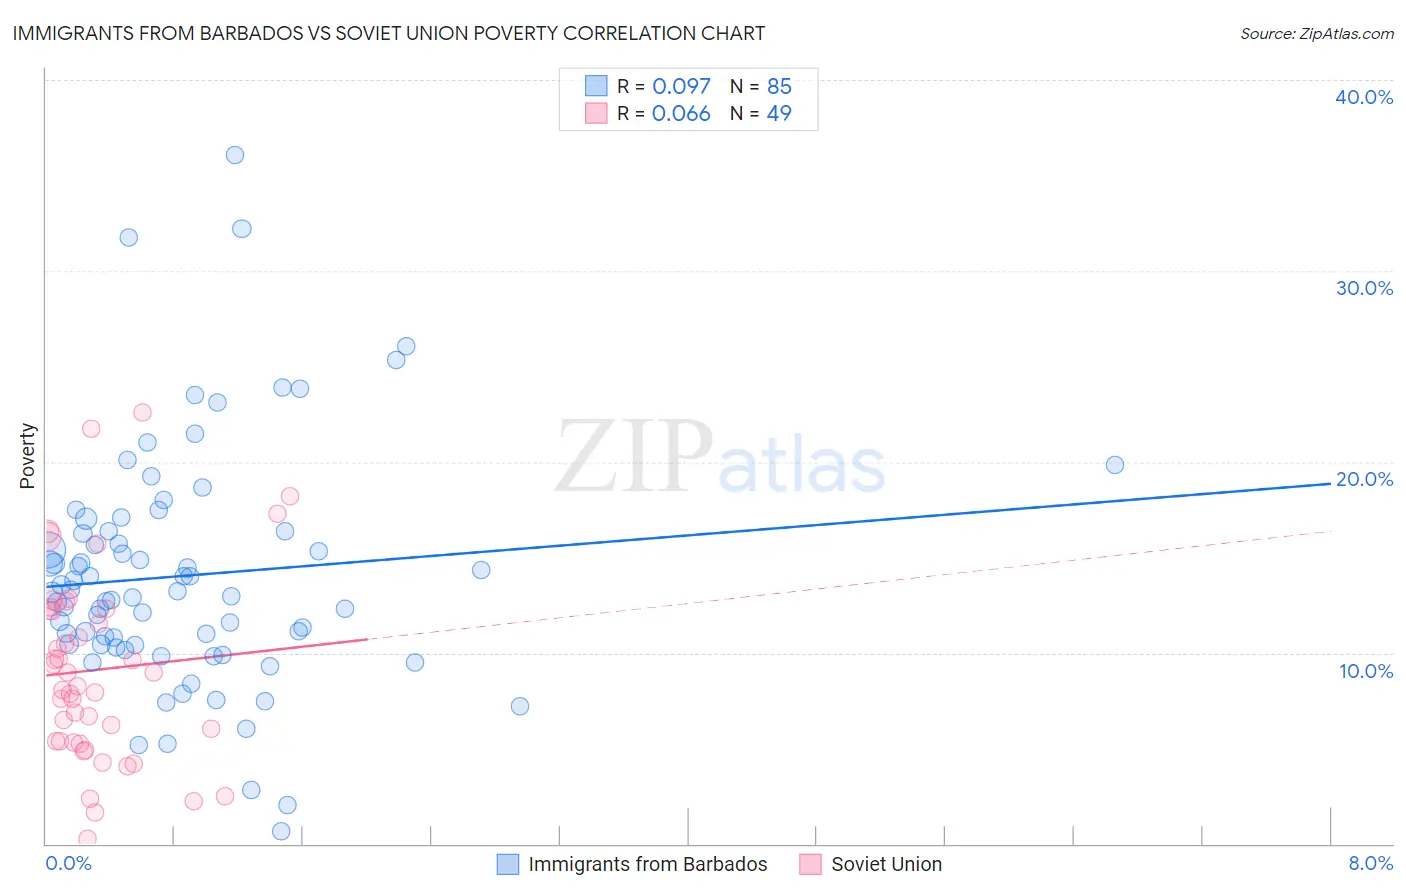
Immigrants from Barbados vs Soviet Union Poverty Correlation Chart
The statistical analysis conducted on geographies consisting of 112,771,584 people shows a slight positive correlation between the proportion of Immigrants from Barbados and poverty level in the United States with a correlation coefficient (R) of 0.097 and weighted average of 14.9%. Similarly, the statistical analysis conducted on geographies consisting of 43,449,399 people shows a slight positive correlation between the proportion of Soviet Union and poverty level in the United States with a correlation coefficient (R) of 0.066 and weighted average of 11.7%, a difference of 27.3%.
Poverty Correlation Summary
| Measurement | Immigrants from Barbados | Soviet Union |
| Minimum | 0.68% | 0.29% |
| Maximum | 36.1% | 22.6% |
| Range | 35.4% | 22.3% |
| Mean | 14.0% | 9.1% |
| Median | 13.2% | 8.3% |
| Interquartile 25% (IQ1) | 10.4% | 5.3% |
| Interquartile 75% (IQ3) | 16.4% | 12.3% |
| Interquartile Range (IQR) | 6.0% | 6.9% |
| Standard Deviation (Sample) | 6.2% | 5.0% |
| Standard Deviation (Population) | 6.2% | 5.0% |
Similar Demographics by Poverty
Demographics Similar to Immigrants from Barbados by Poverty
In terms of poverty, the demographic groups most similar to Immigrants from Barbados are Haitian (14.9%, a difference of 0.070%), Immigrants from St. Vincent and the Grenadines (14.9%, a difference of 0.27%), Comanche (15.0%, a difference of 0.33%), Immigrants from Haiti (15.0%, a difference of 0.45%), and West Indian (15.0%, a difference of 0.55%).
| Demographics | Rating | Rank | Poverty |
| Barbadians | 0.0 /100 | #274 | Tragic 14.8% |
| Immigrants | West Indies | 0.0 /100 | #275 | Tragic 14.8% |
| Immigrants | Bahamas | 0.0 /100 | #276 | Tragic 14.8% |
| Bangladeshis | 0.0 /100 | #277 | Tragic 14.8% |
| Belizeans | 0.0 /100 | #278 | Tragic 14.8% |
| Immigrants | St. Vincent and the Grenadines | 0.0 /100 | #279 | Tragic 14.9% |
| Haitians | 0.0 /100 | #280 | Tragic 14.9% |
| Immigrants | Barbados | 0.0 /100 | #281 | Tragic 14.9% |
| Comanche | 0.0 /100 | #282 | Tragic 15.0% |
| Immigrants | Haiti | 0.0 /100 | #283 | Tragic 15.0% |
| West Indians | 0.0 /100 | #284 | Tragic 15.0% |
| Vietnamese | 0.0 /100 | #285 | Tragic 15.0% |
| Immigrants | Latin America | 0.0 /100 | #286 | Tragic 15.0% |
| Inupiat | 0.0 /100 | #287 | Tragic 15.1% |
| Yaqui | 0.0 /100 | #288 | Tragic 15.1% |
Demographics Similar to Soviet Union by Poverty
In terms of poverty, the demographic groups most similar to Soviet Union are Immigrants from Brazil (11.7%, a difference of 0.040%), Immigrants from Hungary (11.7%, a difference of 0.070%), Immigrants from Norway (11.7%, a difference of 0.080%), New Zealander (11.7%, a difference of 0.090%), and Puget Sound Salish (11.7%, a difference of 0.090%).
| Demographics | Rating | Rank | Poverty |
| Sri Lankans | 89.4 /100 | #117 | Excellent 11.7% |
| Argentineans | 89.1 /100 | #118 | Excellent 11.7% |
| Tlingit-Haida | 89.0 /100 | #119 | Excellent 11.7% |
| Immigrants | South Eastern Asia | 88.9 /100 | #120 | Excellent 11.7% |
| New Zealanders | 88.7 /100 | #121 | Excellent 11.7% |
| Puget Sound Salish | 88.7 /100 | #122 | Excellent 11.7% |
| Immigrants | Hungary | 88.6 /100 | #123 | Excellent 11.7% |
| Soviet Union | 88.4 /100 | #124 | Excellent 11.7% |
| Immigrants | Brazil | 88.2 /100 | #125 | Excellent 11.7% |
| Immigrants | Norway | 88.0 /100 | #126 | Excellent 11.7% |
| Immigrants | Argentina | 88.0 /100 | #127 | Excellent 11.7% |
| Immigrants | Israel | 87.4 /100 | #128 | Excellent 11.7% |
| South Africans | 87.0 /100 | #129 | Excellent 11.7% |
| Immigrants | Ukraine | 86.6 /100 | #130 | Excellent 11.8% |
| French | 86.1 /100 | #131 | Excellent 11.8% |