Egyptian vs Soviet Union Poverty
COMPARE
Egyptian
Soviet Union
Poverty
Poverty Comparison
Egyptians
Soviet Union
11.3%
POVERTY
96.5/ 100
METRIC RATING
82nd/ 347
METRIC RANK
11.7%
POVERTY
88.4/ 100
METRIC RATING
124th/ 347
METRIC RANK
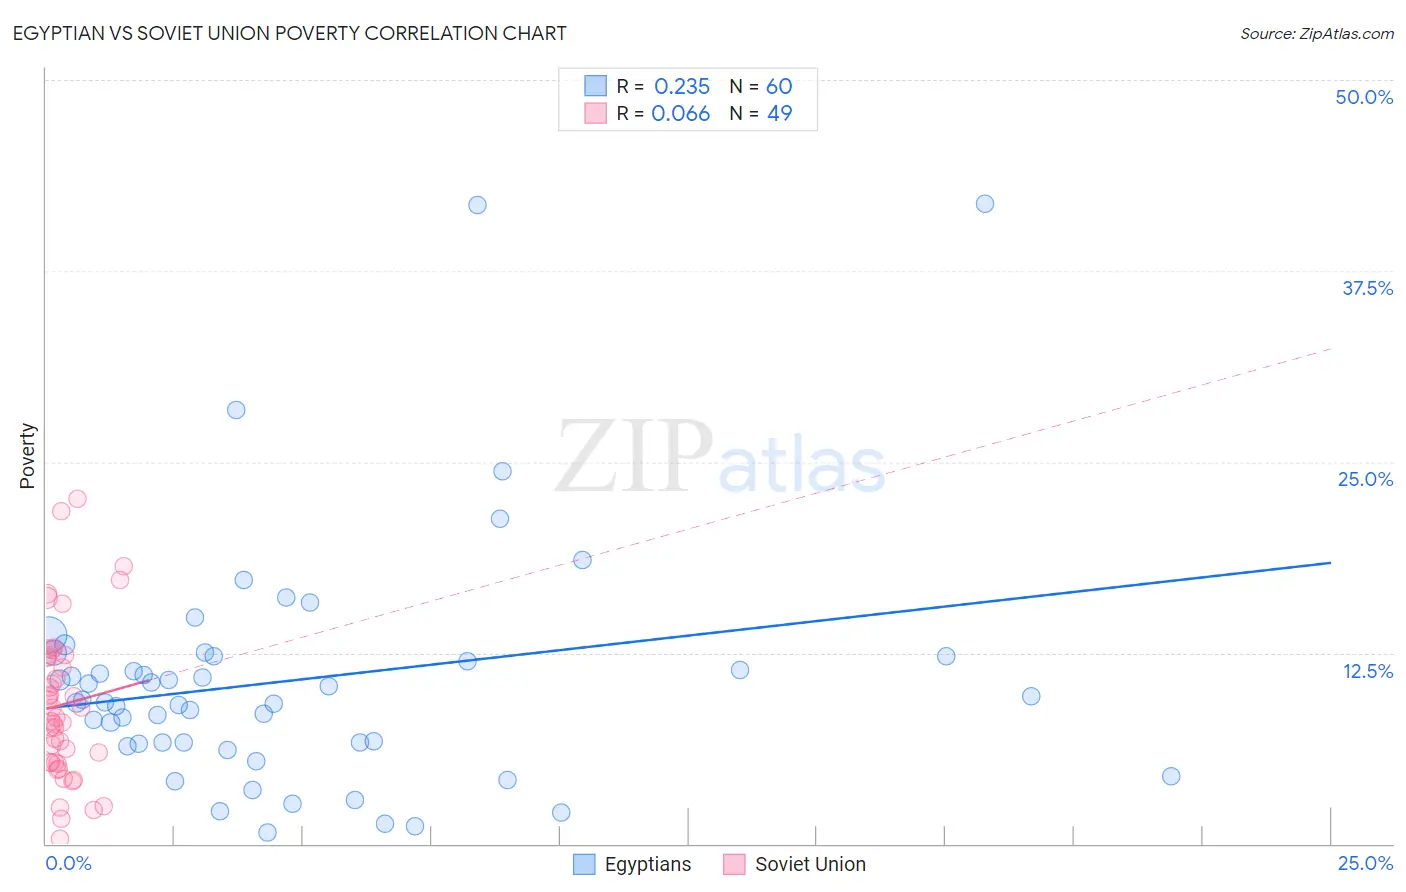
Egyptian vs Soviet Union Poverty Correlation Chart
The statistical analysis conducted on geographies consisting of 276,768,779 people shows a weak positive correlation between the proportion of Egyptians and poverty level in the United States with a correlation coefficient (R) of 0.235 and weighted average of 11.3%. Similarly, the statistical analysis conducted on geographies consisting of 43,449,399 people shows a slight positive correlation between the proportion of Soviet Union and poverty level in the United States with a correlation coefficient (R) of 0.066 and weighted average of 11.7%, a difference of 3.4%.
Poverty Correlation Summary
| Measurement | Egyptian | Soviet Union |
| Minimum | 0.75% | 0.29% |
| Maximum | 41.9% | 22.6% |
| Range | 41.2% | 22.3% |
| Mean | 10.7% | 9.1% |
| Median | 9.3% | 8.3% |
| Interquartile 25% (IQ1) | 6.6% | 5.3% |
| Interquartile 75% (IQ3) | 12.3% | 12.3% |
| Interquartile Range (IQR) | 5.7% | 6.9% |
| Standard Deviation (Sample) | 7.9% | 5.0% |
| Standard Deviation (Population) | 7.8% | 5.0% |
Similar Demographics by Poverty
Demographics Similar to Egyptians by Poverty
In terms of poverty, the demographic groups most similar to Egyptians are Irish (11.3%, a difference of 0.090%), Indian (Asian) (11.3%, a difference of 0.10%), Cambodian (11.3%, a difference of 0.12%), Dutch (11.3%, a difference of 0.16%), and Immigrants from Eastern Asia (11.3%, a difference of 0.18%).
| Demographics | Rating | Rank | Poverty |
| Immigrants | Eastern Europe | 97.0 /100 | #75 | Exceptional 11.3% |
| Immigrants | North America | 96.8 /100 | #76 | Exceptional 11.3% |
| Immigrants | Eastern Asia | 96.7 /100 | #77 | Exceptional 11.3% |
| Dutch | 96.7 /100 | #78 | Exceptional 11.3% |
| Cambodians | 96.7 /100 | #79 | Exceptional 11.3% |
| Indians (Asian) | 96.6 /100 | #80 | Exceptional 11.3% |
| Irish | 96.6 /100 | #81 | Exceptional 11.3% |
| Egyptians | 96.5 /100 | #82 | Exceptional 11.3% |
| Immigrants | Sweden | 96.3 /100 | #83 | Exceptional 11.3% |
| English | 96.3 /100 | #84 | Exceptional 11.3% |
| Immigrants | England | 96.2 /100 | #85 | Exceptional 11.4% |
| Jordanians | 96.0 /100 | #86 | Exceptional 11.4% |
| Northern Europeans | 96.0 /100 | #87 | Exceptional 11.4% |
| Belgians | 95.8 /100 | #88 | Exceptional 11.4% |
| Czechoslovakians | 95.7 /100 | #89 | Exceptional 11.4% |
Demographics Similar to Soviet Union by Poverty
In terms of poverty, the demographic groups most similar to Soviet Union are Immigrants from Brazil (11.7%, a difference of 0.040%), Immigrants from Hungary (11.7%, a difference of 0.070%), Immigrants from Norway (11.7%, a difference of 0.080%), New Zealander (11.7%, a difference of 0.090%), and Puget Sound Salish (11.7%, a difference of 0.090%).
| Demographics | Rating | Rank | Poverty |
| Sri Lankans | 89.4 /100 | #117 | Excellent 11.7% |
| Argentineans | 89.1 /100 | #118 | Excellent 11.7% |
| Tlingit-Haida | 89.0 /100 | #119 | Excellent 11.7% |
| Immigrants | South Eastern Asia | 88.9 /100 | #120 | Excellent 11.7% |
| New Zealanders | 88.7 /100 | #121 | Excellent 11.7% |
| Puget Sound Salish | 88.7 /100 | #122 | Excellent 11.7% |
| Immigrants | Hungary | 88.6 /100 | #123 | Excellent 11.7% |
| Soviet Union | 88.4 /100 | #124 | Excellent 11.7% |
| Immigrants | Brazil | 88.2 /100 | #125 | Excellent 11.7% |
| Immigrants | Norway | 88.0 /100 | #126 | Excellent 11.7% |
| Immigrants | Argentina | 88.0 /100 | #127 | Excellent 11.7% |
| Immigrants | Israel | 87.4 /100 | #128 | Excellent 11.7% |
| South Africans | 87.0 /100 | #129 | Excellent 11.7% |
| Immigrants | Ukraine | 86.6 /100 | #130 | Excellent 11.8% |
| French | 86.1 /100 | #131 | Excellent 11.8% |