European vs Nepalese Family Poverty
COMPARE
European
Nepalese
Family Poverty
Family Poverty Comparison
Europeans
Nepalese
7.7%
FAMILY POVERTY
98.7/ 100
METRIC RATING
59th/ 347
METRIC RANK
10.4%
FAMILY POVERTY
0.8/ 100
METRIC RATING
243rd/ 347
METRIC RANK
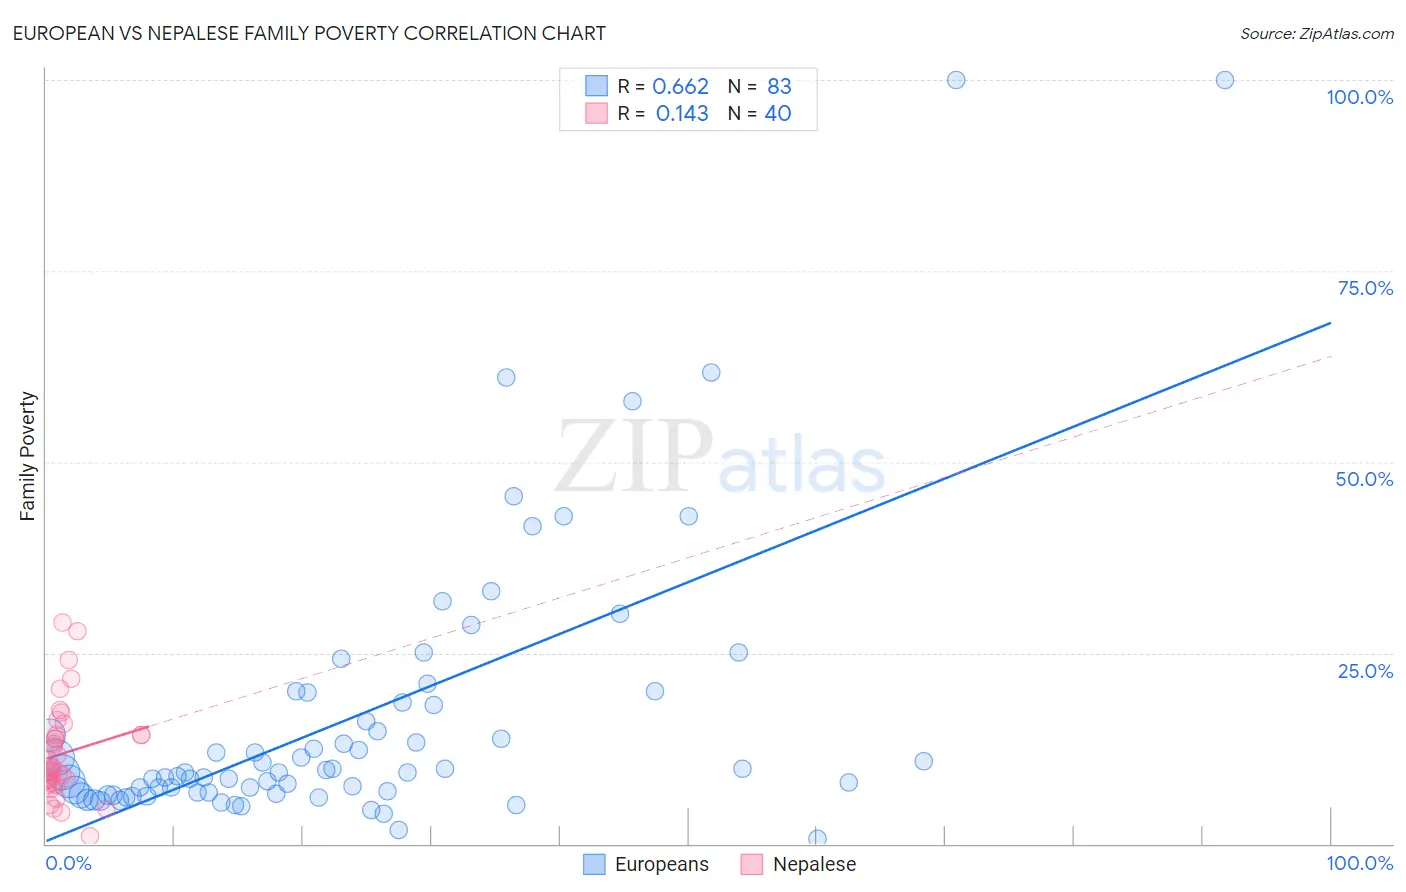
European vs Nepalese Family Poverty Correlation Chart
The statistical analysis conducted on geographies consisting of 557,705,193 people shows a significant positive correlation between the proportion of Europeans and poverty level among families in the United States with a correlation coefficient (R) of 0.662 and weighted average of 7.7%. Similarly, the statistical analysis conducted on geographies consisting of 24,521,755 people shows a poor positive correlation between the proportion of Nepalese and poverty level among families in the United States with a correlation coefficient (R) of 0.143 and weighted average of 10.4%, a difference of 34.7%.
Family Poverty Correlation Summary
| Measurement | European | Nepalese |
| Minimum | 0.65% | 0.90% |
| Maximum | 100.0% | 28.9% |
| Range | 99.4% | 28.0% |
| Mean | 16.6% | 11.8% |
| Median | 9.3% | 9.7% |
| Interquartile 25% (IQ1) | 6.7% | 8.1% |
| Interquartile 75% (IQ3) | 18.4% | 14.2% |
| Interquartile Range (IQR) | 11.8% | 6.1% |
| Standard Deviation (Sample) | 18.6% | 6.2% |
| Standard Deviation (Population) | 18.5% | 6.2% |
Similar Demographics by Family Poverty
Demographics Similar to Europeans by Family Poverty
In terms of family poverty, the demographic groups most similar to Europeans are Finnish (7.7%, a difference of 0.010%), Immigrants from Greece (7.7%, a difference of 0.010%), Asian (7.7%, a difference of 0.040%), Immigrants from Serbia (7.7%, a difference of 0.13%), and Immigrants from Eastern Asia (7.7%, a difference of 0.17%).
| Demographics | Rating | Rank | Family Poverty |
| Indians (Asian) | 98.8 /100 | #52 | Exceptional 7.7% |
| Swiss | 98.8 /100 | #53 | Exceptional 7.7% |
| Immigrants | Sweden | 98.8 /100 | #54 | Exceptional 7.7% |
| Immigrants | Eastern Asia | 98.7 /100 | #55 | Exceptional 7.7% |
| Immigrants | Serbia | 98.7 /100 | #56 | Exceptional 7.7% |
| Asians | 98.7 /100 | #57 | Exceptional 7.7% |
| Finns | 98.7 /100 | #58 | Exceptional 7.7% |
| Europeans | 98.7 /100 | #59 | Exceptional 7.7% |
| Immigrants | Greece | 98.7 /100 | #60 | Exceptional 7.7% |
| Immigrants | Netherlands | 98.6 /100 | #61 | Exceptional 7.7% |
| Macedonians | 98.6 /100 | #62 | Exceptional 7.8% |
| Zimbabweans | 98.4 /100 | #63 | Exceptional 7.8% |
| Koreans | 98.3 /100 | #64 | Exceptional 7.8% |
| Immigrants | Bulgaria | 98.3 /100 | #65 | Exceptional 7.8% |
| Dutch | 98.3 /100 | #66 | Exceptional 7.8% |
Demographics Similar to Nepalese by Family Poverty
In terms of family poverty, the demographic groups most similar to Nepalese are Cree (10.5%, a difference of 0.46%), Alaska Native (10.4%, a difference of 0.48%), Immigrants from Burma/Myanmar (10.5%, a difference of 1.1%), Ghanaian (10.3%, a difference of 1.3%), and Immigrants from the Azores (10.3%, a difference of 1.4%).
| Demographics | Rating | Rank | Family Poverty |
| Immigrants | Nigeria | 1.9 /100 | #236 | Tragic 10.2% |
| Immigrants | Laos | 1.7 /100 | #237 | Tragic 10.2% |
| French American Indians | 1.5 /100 | #238 | Tragic 10.2% |
| Potawatomi | 1.5 /100 | #239 | Tragic 10.2% |
| Immigrants | Azores | 1.4 /100 | #240 | Tragic 10.3% |
| Ghanaians | 1.3 /100 | #241 | Tragic 10.3% |
| Alaska Natives | 1.0 /100 | #242 | Tragic 10.4% |
| Nepalese | 0.8 /100 | #243 | Tragic 10.4% |
| Cree | 0.7 /100 | #244 | Tragic 10.5% |
| Immigrants | Burma/Myanmar | 0.6 /100 | #245 | Tragic 10.5% |
| Cherokee | 0.5 /100 | #246 | Tragic 10.6% |
| Liberians | 0.4 /100 | #247 | Tragic 10.6% |
| Nicaraguans | 0.4 /100 | #248 | Tragic 10.6% |
| Cubans | 0.4 /100 | #249 | Tragic 10.6% |
| Salvadorans | 0.3 /100 | #250 | Tragic 10.7% |