European vs Immigrants from Armenia Family Poverty
COMPARE
European
Immigrants from Armenia
Family Poverty
Family Poverty Comparison
Europeans
Immigrants from Armenia
7.7%
FAMILY POVERTY
98.7/ 100
METRIC RATING
59th/ 347
METRIC RANK
10.0%
FAMILY POVERTY
3.3/ 100
METRIC RATING
227th/ 347
METRIC RANK
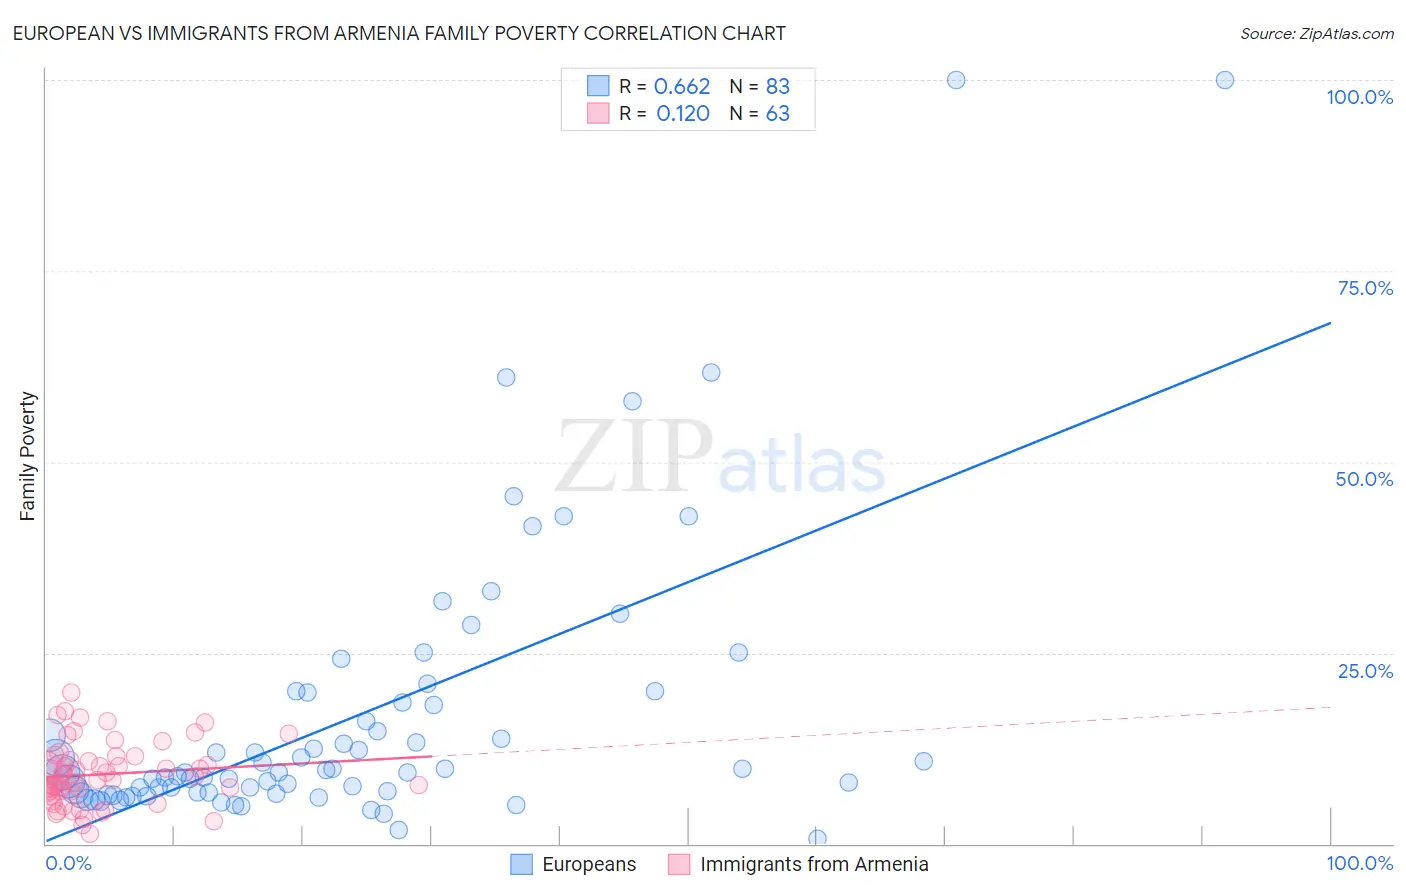
European vs Immigrants from Armenia Family Poverty Correlation Chart
The statistical analysis conducted on geographies consisting of 557,705,193 people shows a significant positive correlation between the proportion of Europeans and poverty level among families in the United States with a correlation coefficient (R) of 0.662 and weighted average of 7.7%. Similarly, the statistical analysis conducted on geographies consisting of 97,632,131 people shows a poor positive correlation between the proportion of Immigrants from Armenia and poverty level among families in the United States with a correlation coefficient (R) of 0.120 and weighted average of 10.0%, a difference of 29.4%.
Family Poverty Correlation Summary
| Measurement | European | Immigrants from Armenia |
| Minimum | 0.65% | 1.2% |
| Maximum | 100.0% | 19.9% |
| Range | 99.4% | 18.6% |
| Mean | 16.6% | 9.1% |
| Median | 9.3% | 8.3% |
| Interquartile 25% (IQ1) | 6.7% | 6.7% |
| Interquartile 75% (IQ3) | 18.4% | 11.5% |
| Interquartile Range (IQR) | 11.8% | 4.8% |
| Standard Deviation (Sample) | 18.6% | 4.1% |
| Standard Deviation (Population) | 18.5% | 4.0% |
Similar Demographics by Family Poverty
Demographics Similar to Europeans by Family Poverty
In terms of family poverty, the demographic groups most similar to Europeans are Finnish (7.7%, a difference of 0.010%), Immigrants from Greece (7.7%, a difference of 0.010%), Asian (7.7%, a difference of 0.040%), Immigrants from Serbia (7.7%, a difference of 0.13%), and Immigrants from Eastern Asia (7.7%, a difference of 0.17%).
| Demographics | Rating | Rank | Family Poverty |
| Indians (Asian) | 98.8 /100 | #52 | Exceptional 7.7% |
| Swiss | 98.8 /100 | #53 | Exceptional 7.7% |
| Immigrants | Sweden | 98.8 /100 | #54 | Exceptional 7.7% |
| Immigrants | Eastern Asia | 98.7 /100 | #55 | Exceptional 7.7% |
| Immigrants | Serbia | 98.7 /100 | #56 | Exceptional 7.7% |
| Asians | 98.7 /100 | #57 | Exceptional 7.7% |
| Finns | 98.7 /100 | #58 | Exceptional 7.7% |
| Europeans | 98.7 /100 | #59 | Exceptional 7.7% |
| Immigrants | Greece | 98.7 /100 | #60 | Exceptional 7.7% |
| Immigrants | Netherlands | 98.6 /100 | #61 | Exceptional 7.7% |
| Macedonians | 98.6 /100 | #62 | Exceptional 7.8% |
| Zimbabweans | 98.4 /100 | #63 | Exceptional 7.8% |
| Koreans | 98.3 /100 | #64 | Exceptional 7.8% |
| Immigrants | Bulgaria | 98.3 /100 | #65 | Exceptional 7.8% |
| Dutch | 98.3 /100 | #66 | Exceptional 7.8% |
Demographics Similar to Immigrants from Armenia by Family Poverty
In terms of family poverty, the demographic groups most similar to Immigrants from Armenia are Ottawa (10.0%, a difference of 0.020%), Sudanese (10.0%, a difference of 0.20%), Immigrants from Uzbekistan (10.0%, a difference of 0.21%), Immigrants from Panama (10.0%, a difference of 0.23%), and Immigrants (10.0%, a difference of 0.29%).
| Demographics | Rating | Rank | Family Poverty |
| Bermudans | 5.3 /100 | #220 | Tragic 9.9% |
| Immigrants | Cambodia | 4.8 /100 | #221 | Tragic 9.9% |
| Japanese | 4.8 /100 | #222 | Tragic 9.9% |
| Immigrants | Africa | 4.3 /100 | #223 | Tragic 9.9% |
| Marshallese | 3.9 /100 | #224 | Tragic 9.9% |
| Immigrants | Immigrants | 3.6 /100 | #225 | Tragic 10.0% |
| Ottawa | 3.3 /100 | #226 | Tragic 10.0% |
| Immigrants | Armenia | 3.3 /100 | #227 | Tragic 10.0% |
| Sudanese | 3.1 /100 | #228 | Tragic 10.0% |
| Immigrants | Uzbekistan | 3.1 /100 | #229 | Tragic 10.0% |
| Immigrants | Panama | 3.1 /100 | #230 | Tragic 10.0% |
| Alaskan Athabascans | 2.7 /100 | #231 | Tragic 10.1% |
| Immigrants | Sudan | 2.3 /100 | #232 | Tragic 10.1% |
| Fijians | 2.1 /100 | #233 | Tragic 10.1% |
| Immigrants | Middle Africa | 2.1 /100 | #234 | Tragic 10.1% |