European vs Immigrants from Zimbabwe Family Poverty
COMPARE
European
Immigrants from Zimbabwe
Family Poverty
Family Poverty Comparison
Europeans
Immigrants from Zimbabwe
7.7%
FAMILY POVERTY
98.7/ 100
METRIC RATING
59th/ 347
METRIC RANK
8.2%
FAMILY POVERTY
94.0/ 100
METRIC RATING
114th/ 347
METRIC RANK
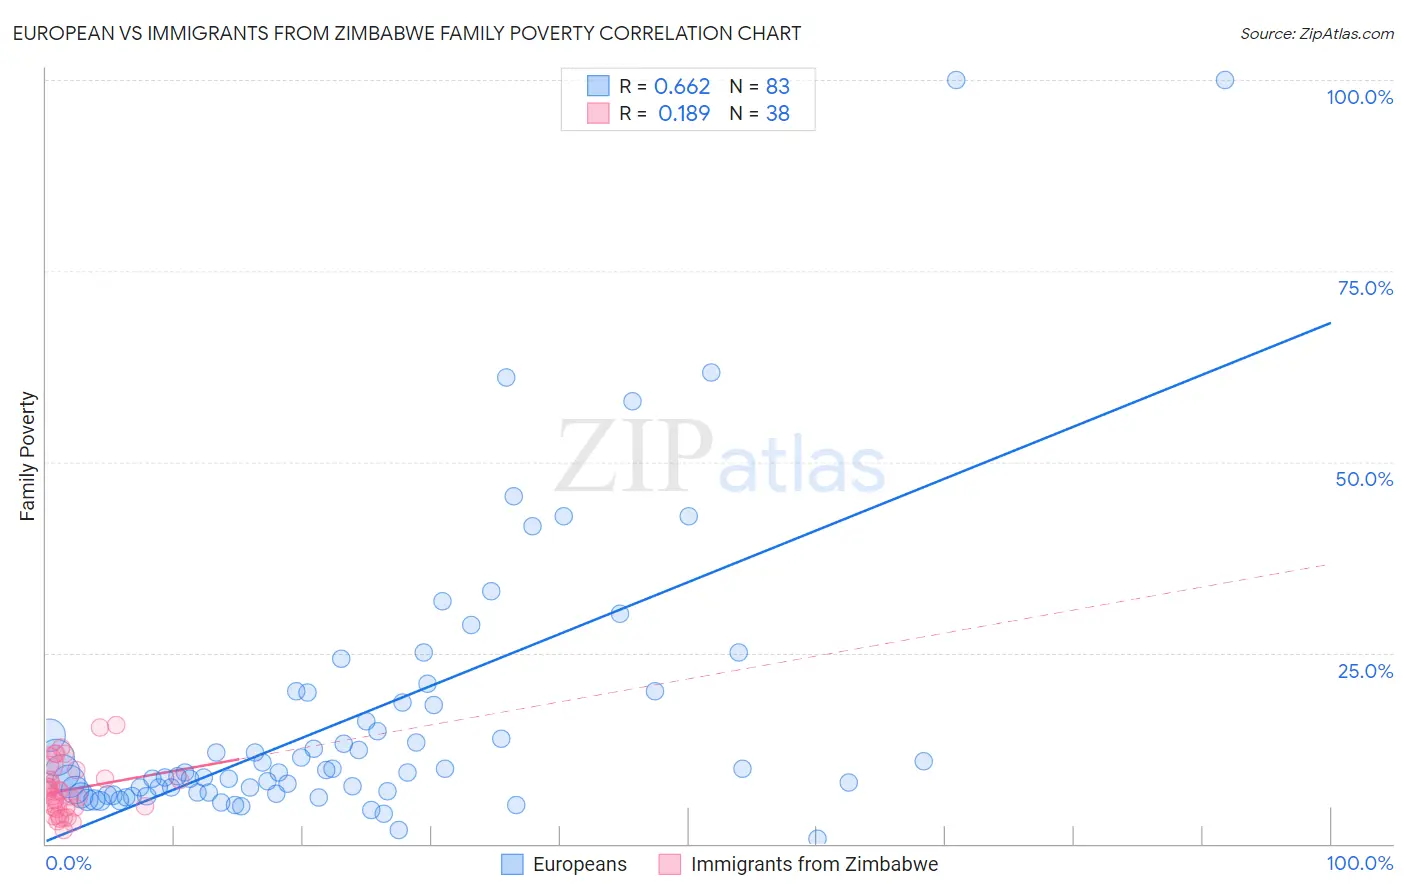
European vs Immigrants from Zimbabwe Family Poverty Correlation Chart
The statistical analysis conducted on geographies consisting of 557,705,193 people shows a significant positive correlation between the proportion of Europeans and poverty level among families in the United States with a correlation coefficient (R) of 0.662 and weighted average of 7.7%. Similarly, the statistical analysis conducted on geographies consisting of 117,739,253 people shows a poor positive correlation between the proportion of Immigrants from Zimbabwe and poverty level among families in the United States with a correlation coefficient (R) of 0.189 and weighted average of 8.2%, a difference of 6.0%.
Family Poverty Correlation Summary
| Measurement | European | Immigrants from Zimbabwe |
| Minimum | 0.65% | 1.8% |
| Maximum | 100.0% | 15.6% |
| Range | 99.4% | 13.8% |
| Mean | 16.6% | 7.1% |
| Median | 9.3% | 6.5% |
| Interquartile 25% (IQ1) | 6.7% | 4.7% |
| Interquartile 75% (IQ3) | 18.4% | 8.5% |
| Interquartile Range (IQR) | 11.8% | 3.8% |
| Standard Deviation (Sample) | 18.6% | 3.4% |
| Standard Deviation (Population) | 18.5% | 3.4% |
Similar Demographics by Family Poverty
Demographics Similar to Europeans by Family Poverty
In terms of family poverty, the demographic groups most similar to Europeans are Finnish (7.7%, a difference of 0.010%), Immigrants from Greece (7.7%, a difference of 0.010%), Asian (7.7%, a difference of 0.040%), Immigrants from Serbia (7.7%, a difference of 0.13%), and Immigrants from Eastern Asia (7.7%, a difference of 0.17%).
| Demographics | Rating | Rank | Family Poverty |
| Indians (Asian) | 98.8 /100 | #52 | Exceptional 7.7% |
| Swiss | 98.8 /100 | #53 | Exceptional 7.7% |
| Immigrants | Sweden | 98.8 /100 | #54 | Exceptional 7.7% |
| Immigrants | Eastern Asia | 98.7 /100 | #55 | Exceptional 7.7% |
| Immigrants | Serbia | 98.7 /100 | #56 | Exceptional 7.7% |
| Asians | 98.7 /100 | #57 | Exceptional 7.7% |
| Finns | 98.7 /100 | #58 | Exceptional 7.7% |
| Europeans | 98.7 /100 | #59 | Exceptional 7.7% |
| Immigrants | Greece | 98.7 /100 | #60 | Exceptional 7.7% |
| Immigrants | Netherlands | 98.6 /100 | #61 | Exceptional 7.7% |
| Macedonians | 98.6 /100 | #62 | Exceptional 7.8% |
| Zimbabweans | 98.4 /100 | #63 | Exceptional 7.8% |
| Koreans | 98.3 /100 | #64 | Exceptional 7.8% |
| Immigrants | Bulgaria | 98.3 /100 | #65 | Exceptional 7.8% |
| Dutch | 98.3 /100 | #66 | Exceptional 7.8% |
Demographics Similar to Immigrants from Zimbabwe by Family Poverty
In terms of family poverty, the demographic groups most similar to Immigrants from Zimbabwe are Canadian (8.2%, a difference of 0.090%), Immigrants from France (8.2%, a difference of 0.26%), Immigrants from Israel (8.2%, a difference of 0.34%), Taiwanese (8.2%, a difference of 0.37%), and South African (8.2%, a difference of 0.41%).
| Demographics | Rating | Rank | Family Poverty |
| French Canadians | 95.0 /100 | #107 | Exceptional 8.1% |
| Basques | 94.9 /100 | #108 | Exceptional 8.1% |
| Jordanians | 94.8 /100 | #109 | Exceptional 8.2% |
| Romanians | 94.7 /100 | #110 | Exceptional 8.2% |
| Taiwanese | 94.6 /100 | #111 | Exceptional 8.2% |
| Immigrants | France | 94.4 /100 | #112 | Exceptional 8.2% |
| Canadians | 94.2 /100 | #113 | Exceptional 8.2% |
| Immigrants | Zimbabwe | 94.0 /100 | #114 | Exceptional 8.2% |
| Immigrants | Israel | 93.5 /100 | #115 | Exceptional 8.2% |
| South Africans | 93.4 /100 | #116 | Exceptional 8.2% |
| Immigrants | Russia | 93.2 /100 | #117 | Exceptional 8.2% |
| Immigrants | Western Europe | 92.9 /100 | #118 | Exceptional 8.2% |
| French | 92.8 /100 | #119 | Exceptional 8.3% |
| Immigrants | Egypt | 91.6 /100 | #120 | Exceptional 8.3% |
| Native Hawaiians | 91.3 /100 | #121 | Exceptional 8.3% |