Immigrants from Iran vs Nepalese Family Poverty
COMPARE
Immigrants from Iran
Nepalese
Family Poverty
Family Poverty Comparison
Immigrants from Iran
Nepalese
7.3%
FAMILY POVERTY
99.7/ 100
METRIC RATING
21st/ 347
METRIC RANK
10.4%
FAMILY POVERTY
0.8/ 100
METRIC RATING
243rd/ 347
METRIC RANK
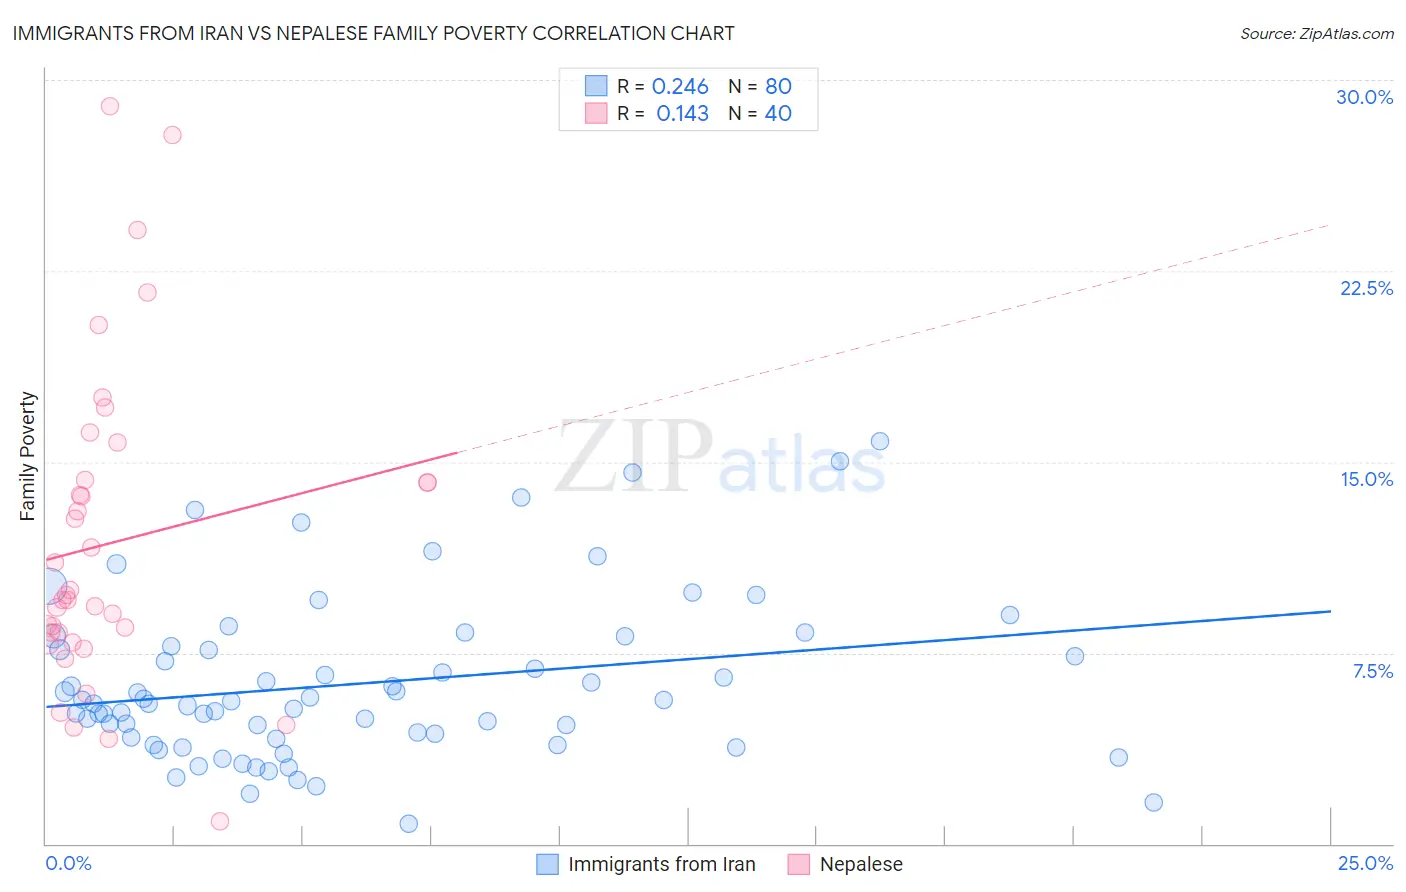
Immigrants from Iran vs Nepalese Family Poverty Correlation Chart
The statistical analysis conducted on geographies consisting of 279,394,600 people shows a weak positive correlation between the proportion of Immigrants from Iran and poverty level among families in the United States with a correlation coefficient (R) of 0.246 and weighted average of 7.3%. Similarly, the statistical analysis conducted on geographies consisting of 24,521,755 people shows a poor positive correlation between the proportion of Nepalese and poverty level among families in the United States with a correlation coefficient (R) of 0.143 and weighted average of 10.4%, a difference of 43.3%.
Family Poverty Correlation Summary
| Measurement | Immigrants from Iran | Nepalese |
| Minimum | 0.76% | 0.90% |
| Maximum | 15.8% | 28.9% |
| Range | 15.0% | 28.0% |
| Mean | 6.3% | 11.8% |
| Median | 5.6% | 9.7% |
| Interquartile 25% (IQ1) | 4.2% | 8.1% |
| Interquartile 75% (IQ3) | 7.7% | 14.2% |
| Interquartile Range (IQR) | 3.5% | 6.1% |
| Standard Deviation (Sample) | 3.2% | 6.2% |
| Standard Deviation (Population) | 3.2% | 6.2% |
Similar Demographics by Family Poverty
Demographics Similar to Immigrants from Iran by Family Poverty
In terms of family poverty, the demographic groups most similar to Immigrants from Iran are Immigrants from Hong Kong (7.3%, a difference of 0.20%), Eastern European (7.2%, a difference of 0.36%), Danish (7.3%, a difference of 0.44%), Assyrian/Chaldean/Syriac (7.3%, a difference of 0.45%), and Immigrants from Lithuania (7.2%, a difference of 0.67%).
| Demographics | Rating | Rank | Family Poverty |
| Iranians | 99.8 /100 | #14 | Exceptional 7.1% |
| Lithuanians | 99.8 /100 | #15 | Exceptional 7.2% |
| Immigrants | South Central Asia | 99.8 /100 | #16 | Exceptional 7.2% |
| Luxembourgers | 99.8 /100 | #17 | Exceptional 7.2% |
| Immigrants | Lithuania | 99.8 /100 | #18 | Exceptional 7.2% |
| Eastern Europeans | 99.7 /100 | #19 | Exceptional 7.2% |
| Immigrants | Hong Kong | 99.7 /100 | #20 | Exceptional 7.3% |
| Immigrants | Iran | 99.7 /100 | #21 | Exceptional 7.3% |
| Danes | 99.7 /100 | #22 | Exceptional 7.3% |
| Assyrians/Chaldeans/Syriacs | 99.7 /100 | #23 | Exceptional 7.3% |
| Croatians | 99.7 /100 | #24 | Exceptional 7.3% |
| Burmese | 99.7 /100 | #25 | Exceptional 7.3% |
| Cypriots | 99.6 /100 | #26 | Exceptional 7.3% |
| Immigrants | Scotland | 99.6 /100 | #27 | Exceptional 7.3% |
| Immigrants | Korea | 99.6 /100 | #28 | Exceptional 7.4% |
Demographics Similar to Nepalese by Family Poverty
In terms of family poverty, the demographic groups most similar to Nepalese are Cree (10.5%, a difference of 0.46%), Alaska Native (10.4%, a difference of 0.48%), Immigrants from Burma/Myanmar (10.5%, a difference of 1.1%), Ghanaian (10.3%, a difference of 1.3%), and Immigrants from the Azores (10.3%, a difference of 1.4%).
| Demographics | Rating | Rank | Family Poverty |
| Immigrants | Nigeria | 1.9 /100 | #236 | Tragic 10.2% |
| Immigrants | Laos | 1.7 /100 | #237 | Tragic 10.2% |
| French American Indians | 1.5 /100 | #238 | Tragic 10.2% |
| Potawatomi | 1.5 /100 | #239 | Tragic 10.2% |
| Immigrants | Azores | 1.4 /100 | #240 | Tragic 10.3% |
| Ghanaians | 1.3 /100 | #241 | Tragic 10.3% |
| Alaska Natives | 1.0 /100 | #242 | Tragic 10.4% |
| Nepalese | 0.8 /100 | #243 | Tragic 10.4% |
| Cree | 0.7 /100 | #244 | Tragic 10.5% |
| Immigrants | Burma/Myanmar | 0.6 /100 | #245 | Tragic 10.5% |
| Cherokee | 0.5 /100 | #246 | Tragic 10.6% |
| Liberians | 0.4 /100 | #247 | Tragic 10.6% |
| Nicaraguans | 0.4 /100 | #248 | Tragic 10.6% |
| Cubans | 0.4 /100 | #249 | Tragic 10.6% |
| Salvadorans | 0.3 /100 | #250 | Tragic 10.7% |